WordPress can write PHP errors to an error log file (commonly wp-content/debug.log) when debug logging is enabled. WP Debug Toolkit gives you a fast way to view that log (and keep access during crashes) via the standalone viewer.
If you only remember one thing:
Most WordPress “error logs” people mean wp-content/debug.log.
Some hosts put the log somewhere else — WP Debug Toolkit supports custom paths.
Where Is the WordPress Debug Log?
By default, WordPress writes its debug log to wp-content/debug.log.
Most sites use that default path. You may see a different file when:
WP_DEBUG_LOG is set to a string path in wp-config.php. For example, define('WP_DEBUG_LOG', '/home/user/logs/wp-errors.log'); writes to that path instead.
Your host redirects WordPress/PHP errors to a host-managed log location (common on managed hosting). GridPane, for instance, uses /logs/debug.log. Kinsta, WP Engine, and Flywheel each have their own log paths accessible through their dashboards.
Your hosting stack skips WordPress logging entirely and sends PHP errors to the server’s general error log (often /var/log/apache2/error.log or /var/log/nginx/error.log). This is more common on shared hosting.
The file won’t exist at all until you enable debug logging (Step 1 below). If you’re not sure where yours is, WP Debug Toolkit identifies most custom paths and stores it in the viewer config; otherwise it falls back to standard debug.log locations.
Step 1: Enable WordPress Error Logging Safely
To create debug.log, WordPress must be configured to log errors.
In WP Debug Toolkit:
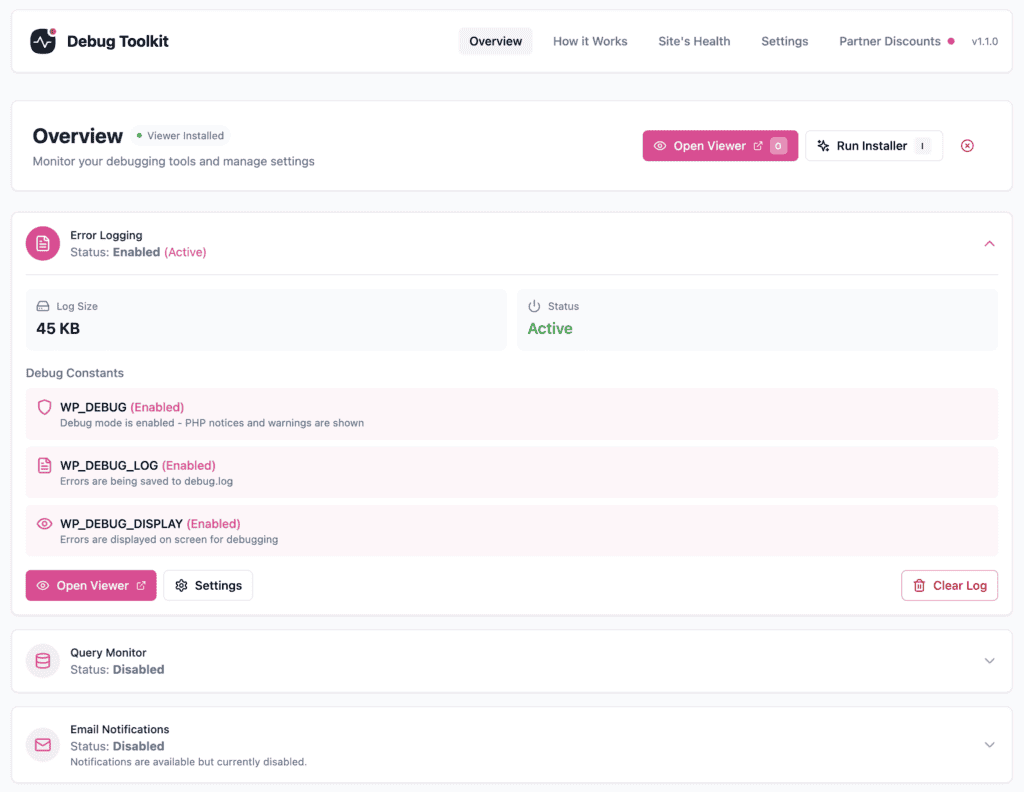
Open Debug Toolkit → Overview.
Enable Error Logging (so errors get written to debug.log). This is both WP_DEBUG and WP_DEBUG_LOG.
If you’re on a non-production environment, Enable Error Display (WP_DEBUG_DISPLAY).
Notes:
On production sites, you typically want Error Display (WP_DEBUG_DISPLAY) disabled (don’t show errors to visitors) and Error Logging (WP_DEBUG_LOG) enabled (log errors privately).
Some hosting stacks use a different log location (e.g. GridPane /logs/debug.log). WP Debug Toolkit supports non-standard paths. Learn more about that here.
Alternative: Enable Logging in wp-config.php
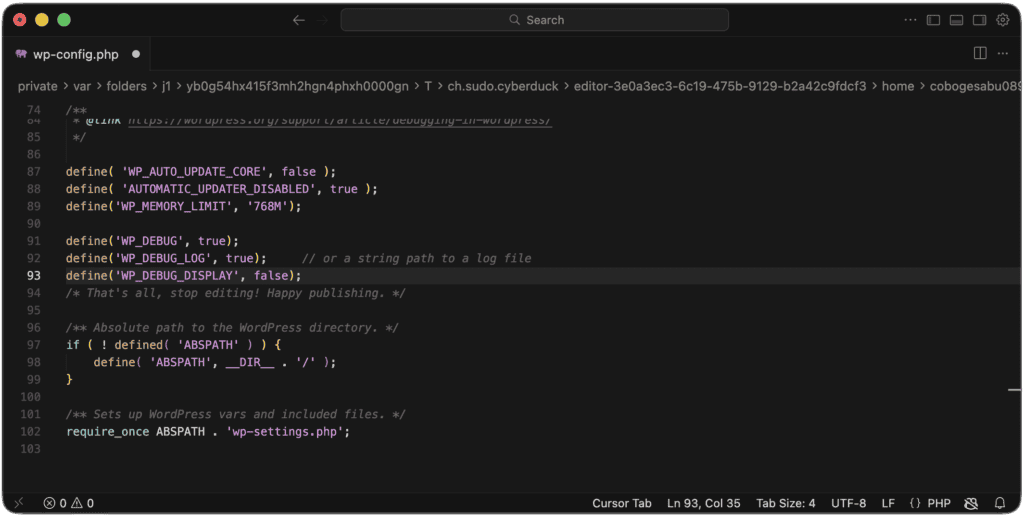
If you can’t access wp-admin, you can set the constants directly. Open wp-config.php and add these lines above the /* That's all, stop editing! */ comment:
define('WP_DEBUG', true);
define('WP_DEBUG_LOG', true);     // or a string path to a log file
define('WP_DEBUG_DISPLAY', false);
WP_DEBUG activates WordPress’s debug mode.
WP_DEBUG_LOG tells WordPress to write errors to wp-content/debug.log. You can also set it to a custom file path string instead of true.
WP_DEBUG_DISPLAY set to false keeps errors out of your site’s HTML output — important on live sites so visitors don’t see raw PHP errors.
After changing wp-config.php, reload the site once to generate log output.
Step 2: Find the Log File Location
Common locations:
wp-content/debug.log (default WordPress location)
A custom path when WP_DEBUG_LOG is set to a string path
Host-specific paths (e.g. /logs/debug.log on some managed hosts)
If you use WP Debug Toolkit, it will recognize the regular path or apply any custom path you define. The plugin will remember the configured log path and the standalone viewer will try to read it automatically. Move to the next step to learn how to use the Viewer.
If you’re doing this manually, check your wp-config.php for the WP_DEBUG_LOG value. If it’s just true, the log is at wp-content/debug.log. If it’s a string, that string is your log file path.
Step 3: View the Log with WP Debug Toolkit (Recommended)
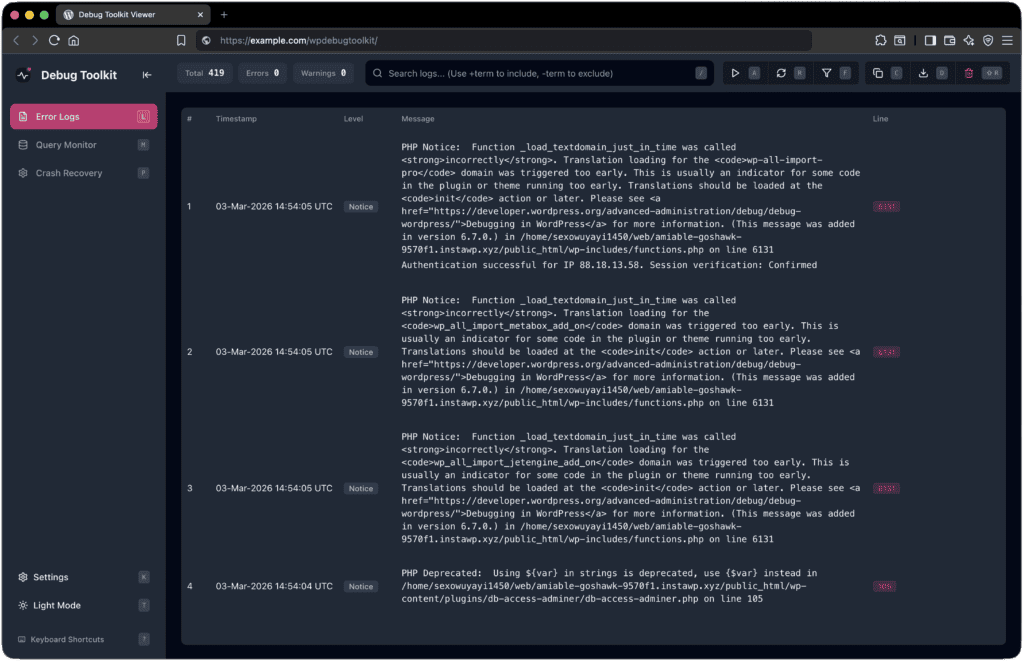
Use the Standalone Viewer
The standalone viewer is installed under a site-root slug like:
https://example.com/wpdebugtoolkit/ (default), or
https://example.com/debug-viewer/ (custom slug)
It continues to work even if WordPress admin is inaccessible, because it does not bootstrap WordPress. White screen, fatal error, database crash, the viewer keeps working regardless.
In the viewer:
Go to Error Logs.
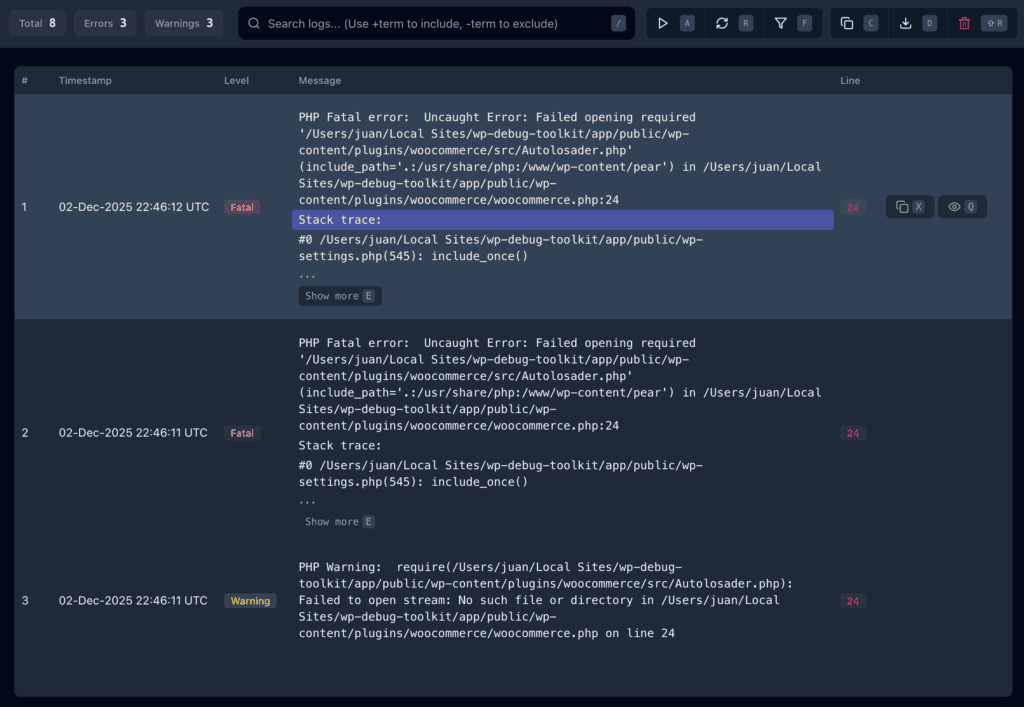
Use the search box to filter entries. It supports +include and -exclude terms (handy when you’re looking for a specific plugin’s errors in a noisy log).
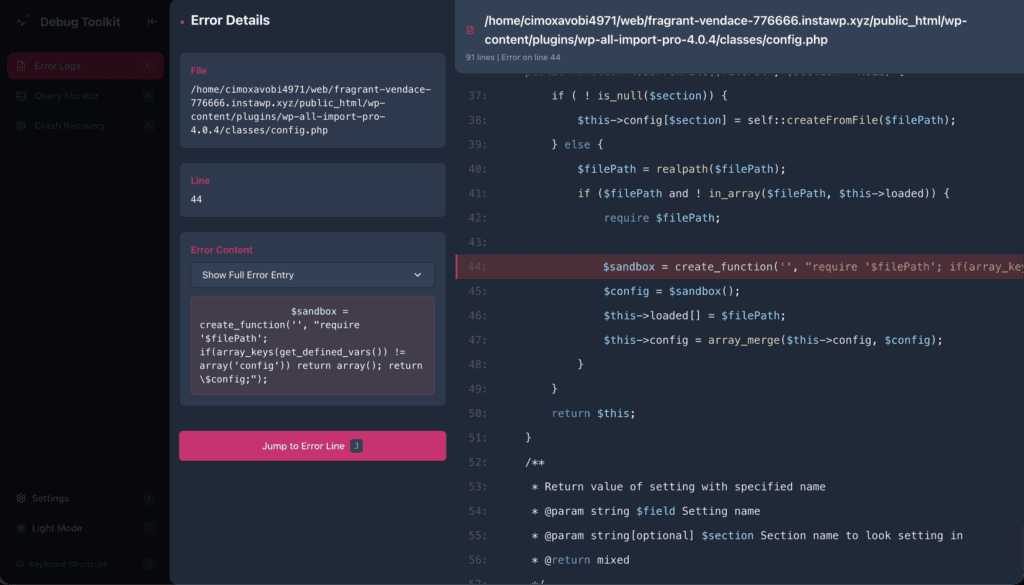
Hover on top of an error line and use the eye icon (or press Q) to open the file viewer around the failing line, so you can see the surrounding code in context.
Use Export (or press D) to export the currently visible entries.
In the WordPress dashboard, you can also work from the WP admin UI to change settings and perform viewer installation/repair. It’s not possible to view the error logs outside of the standalone viewer.
Alternative: View Manually via FTP/SSH
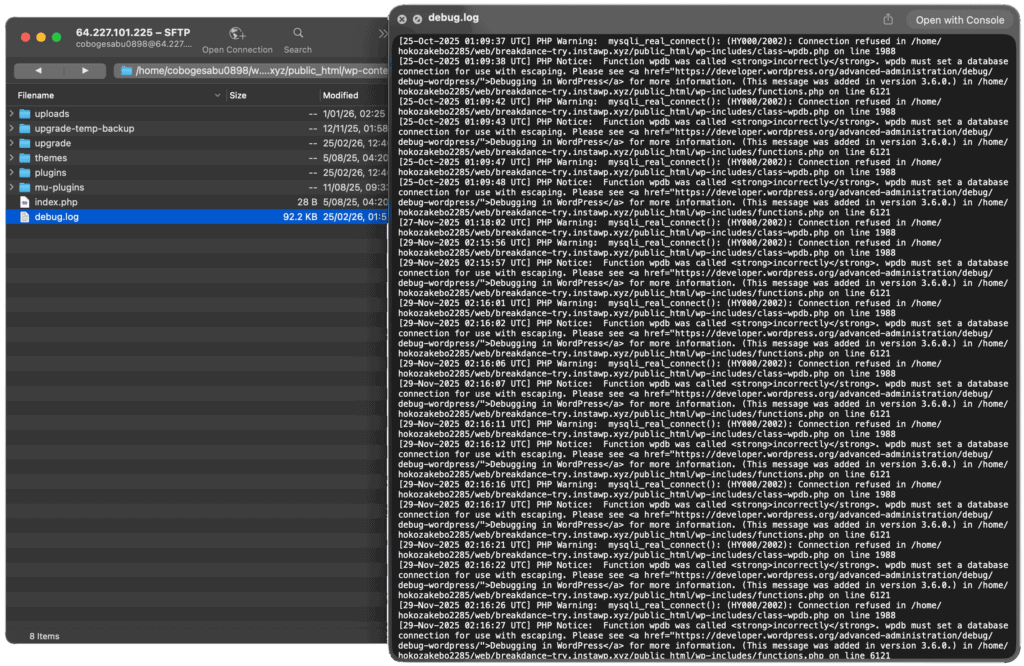
If you don’t have WP Debug Toolkit installed, you can read the log file directly:
Connect to your server via FTP or SSH.
Navigate to wp-content/ (or the custom path from Step 2).
Download debug.log.
Open it in any text editor.
Entries are timestamped and listed oldest-first, so scroll to the bottom for the most recent errors. A typical entry looks like:
[01-Mar-2026 14:32:10 UTC] PHP Fatal error: Allowed memory size of 268435456 bytes exhausted
(tried to allocate 65536 bytes) in /wp-content/plugins/example-plugin/includes/class-import.php on line 215
This tells you the error type (memory exhaustion), the file (class-import.php in the example-plugin plugin), and the line number (215).
Tip: On active sites, debug.log can grow to hundreds of megabytes. Downloading the whole thing via FTP is slow. WP Debug Toolkit‘s viewer loads entries in the browser with search and filtering, which is significantly faster for large logs.
Step 4: Confirm Logging Is Actually Happening
If the log is empty, generate a controlled error on a staging site (for example, enable a plugin known to emit a warning), then refresh the viewer.
If errors still don’t appear after that, check the Troubleshooting section below.
Troubleshooting
debug.log does not exist
The file is only created once WordPress actually logs an error. Ensure all three conditions are met:
WP_DEBUG is enabled (logging is typically tied to debug mode).
WP_DEBUG_LOG is enabled.
The wp-content/ directory is writable by PHP.
Some hosts disable logging or redirect logs elsewhere; use a custom log path if needed.
The viewer shows “empty” but the server has errors
Confirm the viewer is pointing at the right file path.
If your host rotates logs, update the custom path and repair/reinstall the viewer so it picks up the new configuration.
Permission denied / cannot read log
The PHP process needs read access to the log file.
The log file should be readable by the same user that runs PHP (often www-data or your hosting account user).
Fix ownership/permissions or contact your host.
The log is enormous (hundreds of MB)
A noisy plugin or a misconfigured environment can fill the log quickly. WP Debug Toolkit’s viewer handles large files better than downloading via FTP, since it loads entries in the browser with filtering. For long-term management, consider periodically deleting or truncating the log file and addressing the root cause of the most frequent errors.
Advanced Topics
How Do I Check My WordPress Site for Errors?
Enable debug logging to capture PHP errors, then check the log for warnings, notices, and fatal errors. For a broader picture, check HTTP error codes in your server access log and use WP Debug Toolkit’s tools to monitor errors in real time.
“Checking for errors” usually means one of these things:
PHP errors (the error log) — This is what most people mean. Follow Steps 1–4 above to enable logging and view your debug.log. Look for entries marked Fatal error, Warning, or Parse error — those are the ones that break things. Notice and Deprecated entries are less urgent but worth cleaning up over time.
HTTP errors (server-side) — If your site returns 500, 502, 503, or 404 errors to visitors, those are logged in your web server’s access and error logs (not in debug.log). Your hosting control panel usually has a way to view these. See “Where to Find Server Error Logs” below.
Site Health screen — WordPress has a built-in Site Health tool at Tools → Site Health that flags misconfigurations, outdated PHP versions, and other issues. It’s a good starting point but doesn’t show you the actual error log.
WP Debug Toolkit’s approach — The plugin brings these together. The standalone viewer gives you the error log, the file viewer lets you inspect source code around the error, and the Overview dashboard shows the current state of debug constants.
How to Check Critical Errors in WordPress
A “critical error” usually means a PHP fatal error that triggers WordPress’s Recovery Mode. Enable debug logging, then check debug.log for the fatal error message. If wp-admin is locked out, use WP Debug Toolkit’s standalone viewer or access the log via FTP.
Since WordPress 5.2, a fatal PHP error triggers a screen that says “There has been a critical error on this website.” Behind the scenes, WordPress sends a recovery mode email to the admin address with a special link to log in and deactivate the offending plugin or theme.
If you can access wp-admin (via recovery mode link):
Use the recovery link from the email WordPress sent you.
Open Debug Toolkit → Overview and make sure Error Logging is on.
Open the standalone viewer and you’ll see the error logs right away.
The most recent Fatal error entry will tell you exactly which file and line caused the crash — for example: Fatal error: Uncaught Error: Call to undefined function ... in /wp-content/plugins/example/file.php on line 42.
Deactivate the responsible plugin or switch themes via Crash Recovery.
If you can’t access wp-admin at all:
This is where the standalone viewer shines — it doesn’t rely on WordPress, so it works even when the entire admin is down.
Visit the viewer URL directly (e.g., https://example.com/wpdebugtoolkit/).
Check the error log for the fatal error.
If the viewer isn’t installed yet, fall back to FTP: download wp-content/debug.log and read the last entries.
If there’s nothing in the log:
Debug logging may not be enabled yet. Use WP Debug Toolkit to enable Error Logging or add the WP_DEBUG constants to wp-config.php manually via FTP (see Step 1).
Some fatal errors happen before WordPress can write to the log. In that case, check your host’s PHP error log (usually accessible through cPanel, Plesk, or your hosting dashboard).
Where to Find Server Error Logs
Server error logs live outside WordPress — typically at /var/log/apache2/error.log (Apache) or /var/log/nginx/error.log (Nginx). Most hosting control panels expose these under a “Logs” or “Error Log” section.
WordPress’s debug.log only captures PHP errors routed through WordPress itself. Your web server has its own error log that captures everything else: 502 Bad Gateway errors, timeout issues, mod_security blocks, SSL handshake failures, and so on.
Where to look by hosting type:
cPanel hosting: Log in to cPanel → Error Log (under Metrics). This usually shows the most recent Apache/LiteSpeed errors.
Plesk: Websites & Domains → Logs.
GridPane, RunCloud, SpinupWP: These platforms typically have a log viewer in their dashboard, or you can SSH in and check /var/log/ directly.
WP Engine, Kinsta, Flywheel: Managed hosts often provide log access through their own dashboard under a “Logs” section. The paths vary by provider.
VPS / dedicated server: SSH in and check /var/log/apache2/error.log, /var/log/nginx/error.log, or /var/log/php-fpm/error.log depending on your stack.
Keep in mind: Server error logs and WordPress’s debug.log are different files logging different things. If you’re seeing a 500 error on your site but debug.log is empty, the issue is likely logged in the server error log instead — especially if it’s a timeout, memory limit, or .htaccess problem.
How to Debug Errors in WordPress
Enable debug logging, reproduce the error, read the log to identify the file and line number, then trace it back to a specific plugin, theme, or custom code. WP Debug Toolkit makes this loop faster with its built-in search, file viewer, and crash-proof standalone access.
Debugging a WordPress error is a process, not a single step. Here’s the practical workflow:
1. Enable logging and reproduce the error. Turn on WP_DEBUG and WP_DEBUG_LOG (either through WP Debug Toolkit’s dashboard or manually in wp-config.php). Then trigger the error again — reload the broken page, re-run the failed action, etc.
2. Read the log and identify the source. Open the error log (via WP Debug Toolkit’s viewer or by downloading the file). Look at the most recent entries. A typical error entry tells you the error type, the file path, and the line number.
3. Inspect the code. In WP Debug Toolkit’s viewer, click the file path to open the file viewer around the failing line. You’ll see the surrounding code, which helps you understand context — is this a loop running too many times? A query returning too much data?
4. Narrow it down with conflict testing. If the error is intermittent or you’re not sure which plugin is responsible, deactivate all plugins and switch to a default theme (like Twenty Twenty-Five). Re-enable them one by one until the error reappears. The error log makes this much faster because you can see exactly when new errors start appearing as you reactivate each plugin.
5. Fix or report. If it’s your custom code, fix the issue at the source. If it’s a third-party plugin or theme, check for updates, search their support forums, or report the bug with the error log entry — developers appreciate getting the exact error message, file, and line number.
Summary
Method
Requires FTP?
Works during crashes?
Search & filtering?
WP Debug Toolkit (standalone viewer)
No
Yes
Yes
WP Debug Toolkit (wp-admin)
No
No (needs wp-admin)
Yes
Manual (wp-config.php + FTP)
Yes
N/A (read the file offline)
No (use a text editor)
For most people, the fastest path is: install WP Debug Toolkit, enable error logging from the dashboard, and use the standalone viewer whenever you need to check errors. The manual method is a solid fallback when you can’t install a plugin at all.
The best error log viewer with amazing developer tools to help you troubleshoot your WordPress site securely and efficiently. Something something more.