
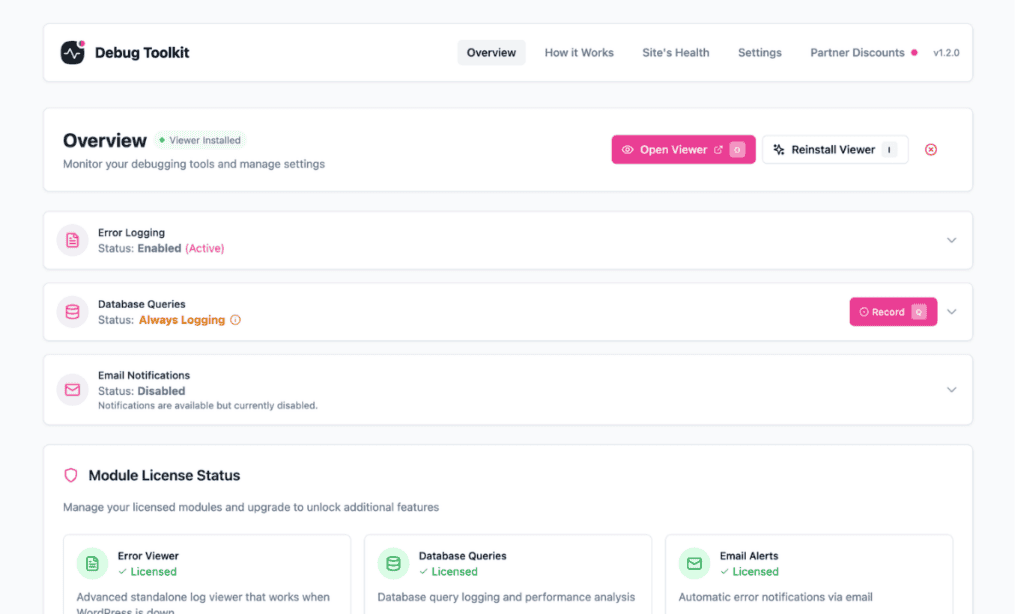
To confirm WP Debug Toolkit (WPDT) is working end-to-end: navigate to WP Debug Toolkit › Overview, click the Error Logging section, then click WP_DEBUG and WP_DEBUG_LOG to enable them. Visit several pages on your site to give WordPress a chance to write log output, then open your Viewer App URL and log in to confirm that the entry appears. Taken together, the three steps verify that WPDT captures errors, WordPress logs them, and the Viewer App reads the file correctly.
You have installed WP Debug Toolkit, activated a license, and set up the Viewer App on your WordPress site, but you have not yet seen the full workflow in action.
You want confirmation that error capture is on, that WordPress is writing log output, and that the Viewer App is reading it. Nothing has broken yet; this is simply a verification pass before you need these tools under pressure.
WPDT uses two tools for this check: Debug Management, which controls the WP_DEBUG constants directly from wp-admin without requiring FTP access or any manual file editing, and the Viewer App, a standalone application that reads debug.log independently of WordPress and remains accessible to you even when WordPress is down. This guide walks you from a fresh WPDT installation to your first confirmed error log entry visible in the Viewer App.
Ensure that the following are in place:
WP_DEBUG and WP_DEBUG_LOG are either already enabled on your site or you will enable them in Phase 1 of this guide.Navigate to WP Debug Toolkit › Overview and click the Error Logging section to open it.
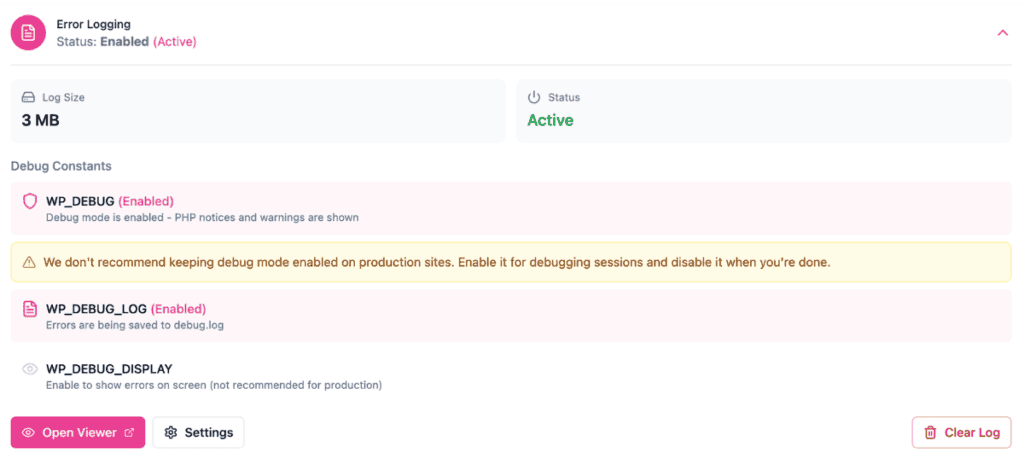
You need two constants active for this walkthrough: WP_DEBUG and WP_DEBUG_LOG. If not already enabled, click each one to enable it. Active constants show (Enabled) in pink.
WP_DEBUG turns on debug mode. WordPress starts reporting PHP errors, notices, and warnings instead of silently swallowing them. A yellow warning banner appears below, reminding you to disable debug mode when you are finished. WP_DEBUG_LOG turns on error logging. Every error WordPress reports is now written to wp-content/debug.log, which is the file the Viewer App reads.Skip WP_DEBUG_DISPLAY, as enabling it pushes raw PHP error output directly into the browser, making it visible to anyone on your site. This can pose a significant security risk to your site, so leave it disabled.
WPDT writes each change to wp-config.php immediately. Before touching the file, WPDT automatically creates a backup, so the previous state is always recoverable if something goes wrong.
WP-CLI alternative:
bash
# Enables WP_DEBUG and WP_DEBUG_LOG without enabling WP_DEBUG_DISPLAY
wp dbtk debug on
✅ What You Should See
Both WP_DEBUG and WP_DEBUG_LOG show (Enabled) in pink. WP_DEBUG_DISPLAY shows no enabled label. The Status indicator at the top of the panel reads Active. A yellow warning banner appears below WP_DEBUG. This confirms debug mode is on and is normal at this stage.
With WP_DEBUG and WP_DEBUG_LOG both enabled, WordPress writes any PHP errors, notices, and warnings to wp-content/debug.log during each page load. The amount of output depends on which plugins and themes are active on your site.
You can visit any page on your site, such as the front page, a single post, or the wp-admin dashboard, to give WordPress the opportunity to generate log output.
WordPress executes its full loading sequence on every page visit, and any PHP errors or notices that occur during that execution get written to debug.log.
One thing to be aware of is that if your site’s code and plugins are functioning cleanly, it may produce little or no log output, because debug.log is only created or updated when WordPress actually encounters an error, warning, or notice.
If you want a guaranteed entry to confirm that the workflow is functioning as it should, do this on a staging site: temporarily activate a plugin you know generates PHP deprecation notices, visit a page, then deactivate it. That gives you a controlled log entry without risking anything on a live environment.
✅ What You Should See
No immediate visual feedback appears in your browser. WordPress writes log output to the server silently in the background. Phase 3 confirms whether the entry arrived in the log.
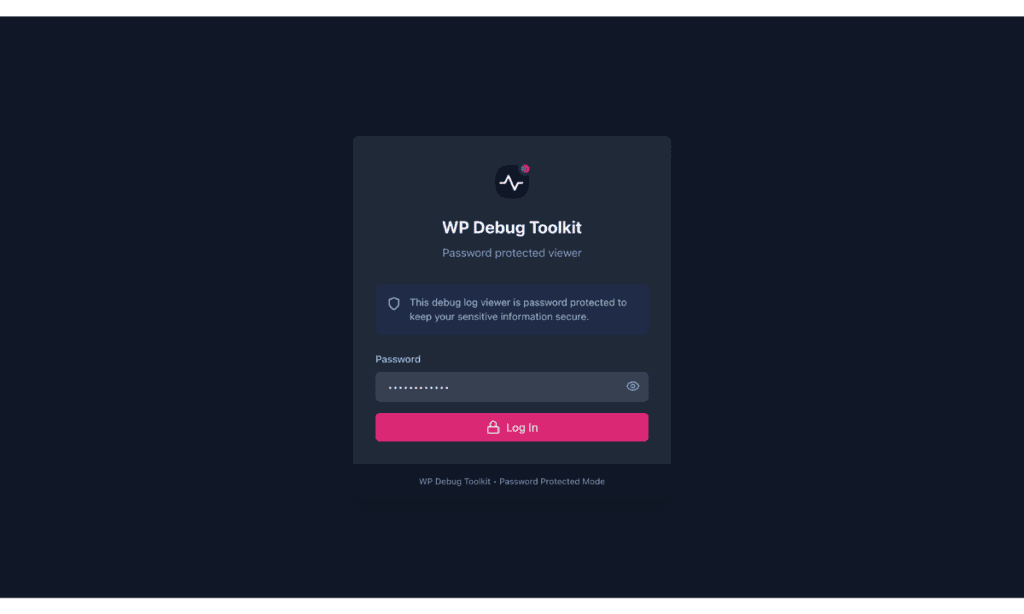
Open your Viewer App URL in a browser. The URL follows the pattern https://yoursite.com/wpdebugtoolkit/ unless you set a custom slug during installation.
✅ What You Should See
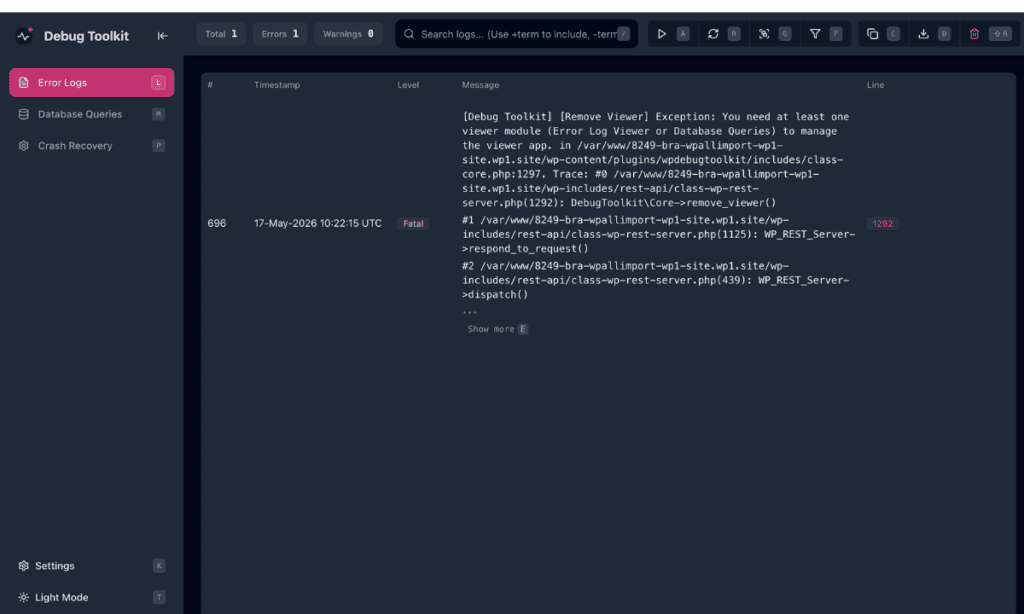
The Viewer App displays the error log. If WordPress generated any PHP errors, notices, or warnings during the page visit in Phase 2, they appear here. This confirms the full workflow is connected: WPDT is capturing errors, WordPress is writing them to wp-content/debug.log, and the Viewer App is reading that file directly from the filesystem.
🔀 Decision Point
If the viewer shows an empty state, work through these checks in order.
– WP_DEBUG_LOG is not enabled: Return to WP Debug Toolkit › Overview and confirm that both WP_DEBUG and WP_DEBUG_LOG show (Enabled) in pink. If either is inactive, click it to enable it, then revisit a page on your site and reload the viewer.
– No errors occurred on the pages you visited: A site running clean code and well-maintained plugins may generate no log output at all. Try the controlled error approach from Phase 2 to confirm that the workflow is functioning properly.
– Still empty after both checks: A permissions issue or a host-specific log path may be preventing debug.log from being written or read correctly. See the Common Issues and How to Fix Them section below.
Likely cause: The wp-content/ directory is not writable by PHP, so WordPress cannot create debug.log in the first place.
Fix: Check the permissions on wp-content/. PHP needs write access to create and update the log file, and the Viewer App separately needs read access to that file to display its contents. Your host’s support team can confirm the correct permissions for your server environment.
Likely cause: WPDT auto-detects the debug log path at install time, but on some managed hosts, the detected path may not match where WordPress is actually writing errors.
Fix: Navigate to WP Debug Toolkit › Settings and open the Viewer Settings tab. Scroll to File Paths Configuration and check the path shown under Debug Log. If it is incorrect, click Override, enter the correct path for your host, then click Save Custom Paths.

Likely cause: Some errors happen at the server level rather than the WordPress application level. Server timeouts, .htaccess problems, and HTTP 500 errors are captured by Apache or Nginx in their own error logs, not by WordPress’s debug.log.
Similarly, certain fatal PHP errors occur early in the WordPress startup sequence, before the logging system has initialized, so they are never written to the log file.
Fix: For server-level errors, check your host’s server error logs directly. For fatal errors that appear in neither debug.log nor the Viewer App, contact your host to confirm whether their environment intercepts WordPress logging entirely.
Yes, with one condition: keep WP_DEBUG_DISPLAY disabled. With WP_DEBUG_DISPLAY off, WordPress writes errors to debug.log on the server and never exposes them to visitors. The recommended production configuration is WP_DEBUG on, WP_DEBUG_LOG on, and WP_DEBUG_DISPLAY off. You can review everything through the Viewer App at any time without exposing any output publicly. See How to Automatically Enable WordPress Debug Mode for the full environment-by-environment settings reference.
Confirm that both WP_DEBUG and WP_DEBUG_LOG on WP Debug Toolkit › Overview show (Enabled) in pink. Then try the controlled error approach from Phase 2 to rule out a clean-code false negative. If the log stays empty after that, work through the Common Issues and How to Fix Them section above. Permissions and host-specific log paths are the most common causes at that point.
How to Automatically Enable WordPress Debug Mode – Learn what each debug constant does and find the recommended settings for production, staging, and development environments.
Setting Up the WordPress Error Logs Viewer App – Install and configure the standalone Viewer App, including setup, WP-CLI options, and how to override file paths for non-standard hosting environments.
Activating and Deactivating Your License – Activate your WPDT license and confirm which modules it unlocks if anything appears locked after completing this walkthrough.