
The WP Debug Toolkit (WPDT) Error Log Viewer transforms your WordPress debug.log file into a structured, filterable dashboard inside a standalone viewer application. Enable error logging from the WP Debug Toolkit Overview page, then open the Viewer App to browse, filter, and inspect log entries in real time, without needing FTP access or page refreshes. Because the Viewer App operates independently of WordPress, it remains accessible even when your site has a fatal error and won’t load.
WordPress writes PHP errors, warnings, and notices to a flat text file called debug.log. To read it, you download it over FTP, open it in a text editor, and manually scan thousands of sequential lines for the one entry that matters.
On any site with active plugins, that file fills with noise fast. You’ll find multiple deprecated function notices from multiple plugins stacking up right alongside the fatal error you’re actually trying to find.
The WPDT debug log plugin, through its Error Log Viewer, replaces that workflow with a structured, searchable dashboard that reads your log directly and puts the signal above the noise.
On a busy production site, debug.log becomes unmanageable without tools to cut through repetition and irrelevance. WPDT gives you multiple capabilities to do exactly that.
Smart filtering with +include and -exclude operators lets you isolate entries from a specific plugin while hiding everything else.
Independent error level toggles for Notice, Warning, Parse, Fatal and Error let you focus on critical failures without wading through non-breaking notices.
Error deduplication groups repeated entries instead of listing each occurrence separately, so a recurring error doesn’t bury everything else in your log. And the integrated file viewer expands any entry inline to show the exact PHP line and surrounding code that triggered it. Together, these take you from “something is wrong” to “I know what to fix” in a fraction of the time.
WP Debug Toolkit’s Error Log Viewer updates in real time as new entries are written to your log. No page refresh is required: errors appear in the Viewer App the moment WordPress writes them.
WPDT reads your WordPress error log directly from disk and surfaces it in the Viewer App, a standalone application that you install separately from the WordPress plugin. The Viewer App does not rely on WordPress to render or deliver the log data.
debug.log directly from disk. This means enabling error logging adds no database queries or table writes to your site’s load.This guide assumes that WP Debug Toolkit is installed, your license is active, and your Viewer App is set up. If you haven’t done that yet, start with Setting Up the WordPress Error Logs Viewer App before continuing.
Navigate to WP Debug Toolkit › Overview. The Overview page displays a module card for Error Logging showing its current status. If the status reads Disabled, click the Error Logging row to expand it, then click WP_DEBUG and WP_DEBUG_LOG to turn them on.
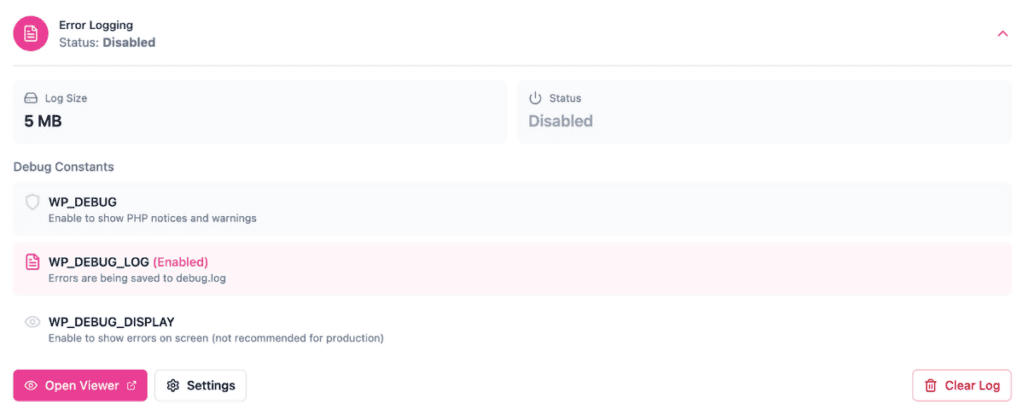
Once you do this, WPDT enforces the logging settings for your environment, eliminating the need for you to edit wp-config.php manually or use FTP.
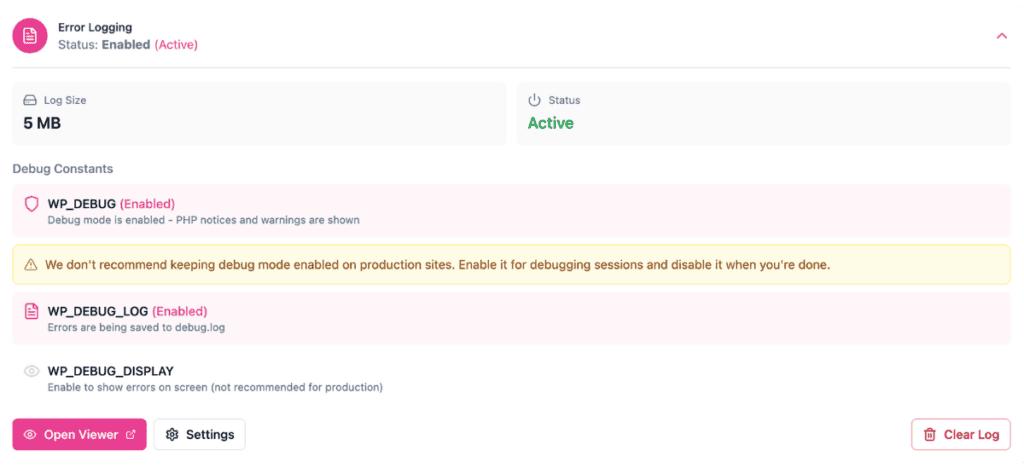
✅ What You Should See: The Error Logging row on the Overview page updates its status indicator to Enabled (Active). WPDT is now capturing PHP errors as they occur on your site.
Open any page on your WordPress site in a browser tab. This gives PHP a chance to execute and write entries to the log. If your site already has errors in debug.log from before you enabled WPDT, those entries will appear immediately in the next step.
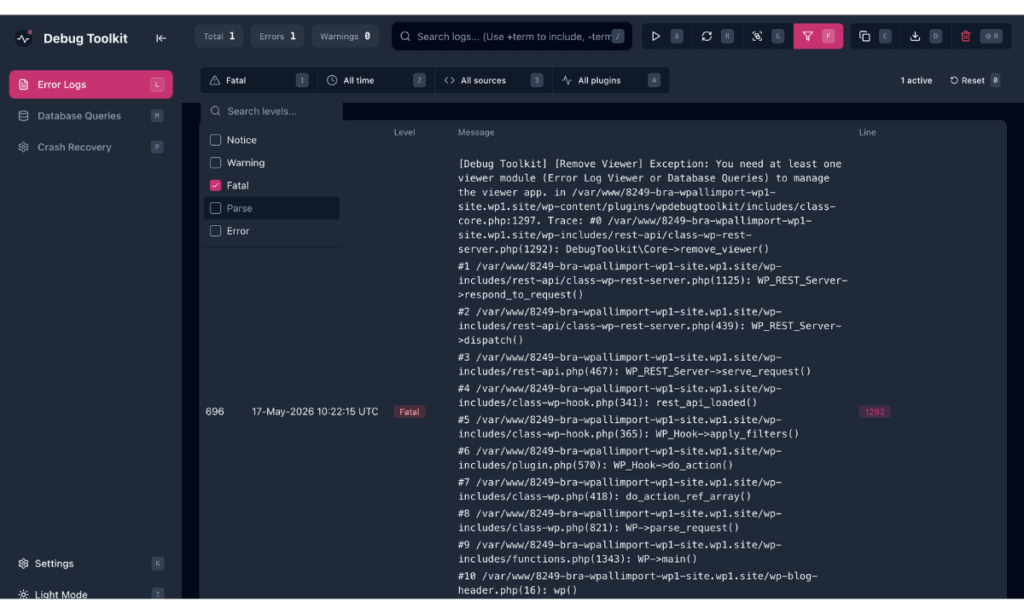
Navigate to the Viewer App at the URL you set during installation. The Viewer App loads independently of WordPress and displays your error log with entries listed in reverse chronological order, most recent first.
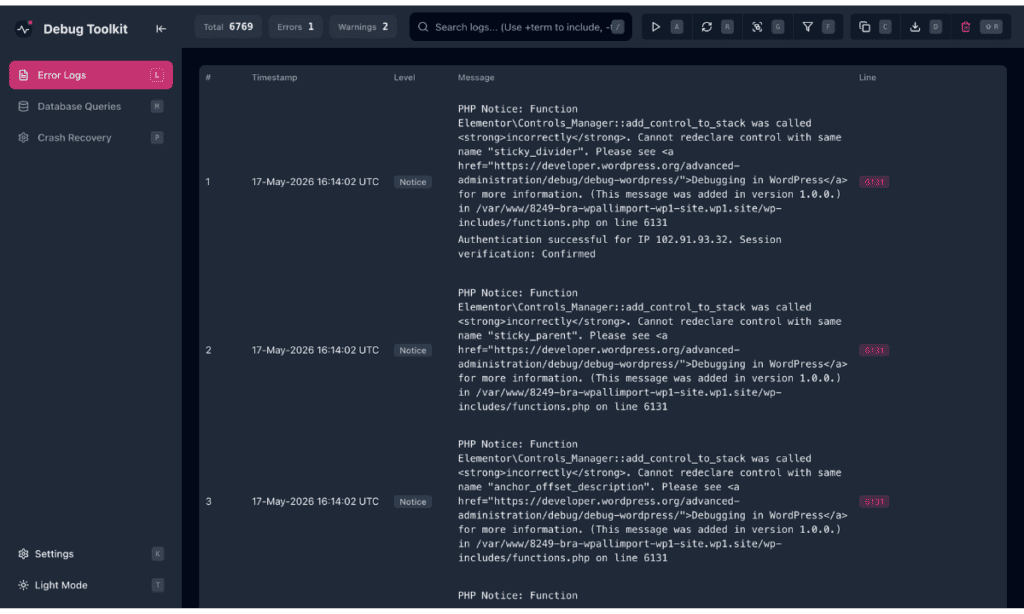
✅ What You Should See: The Viewer App displays your error log entries listed in reverse chronological order. The toolbar at the top shows a running count of total entries, errors, and warnings. Each entry displays its timestamp, a color-coded level badge (Fatal, Error, Parse, Warning, or Notice), the error message, and the source file path with a line number. If the log is empty, no PHP errors have been written since logging was enabled. You can visit a few pages on your site to generate activity, then return to the viewer.
The Viewer App gives you two ways to narrow your log: a text search field and four dropdown filters that work in combination.
Type directly into the Search logs field using +include and -exclude operators to match against the full text of each entry, including error messages, file paths, and function names.
# Type directly into the Search logs field

+woocommerce              # Show only entries containing "woocommerce"
-Notice                   # Hide all Notice-level entries
+woocommerce -Notice      # Show WooCommerce entries, hide Notices
+fatal -my-plugin-name    # Show fatals, hide entries from a specific plugin
Use the four dropdown filters in the filter bar to narrow results further without typing:
Click Reset in the filter bar to clear all active filters at once.
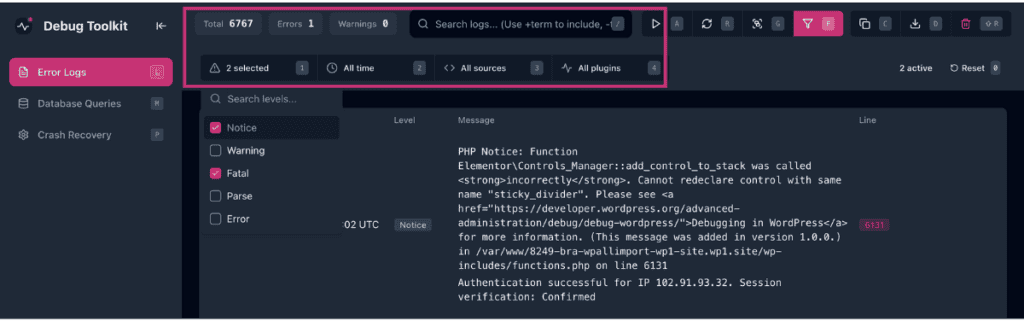
Click the All levels filter in the filter bar to open the level dropdown. Check or uncheck individual levels, including Notice, Warning, Fatal, Parse, and Error, to show or hide entire error classes.
Uncheck Notice and Warning when you’re diagnosing a fatal crash and don’t need surrounding noise. The filter applies immediately, and the entry count in the toolbar updates to reflect what’s visible.
Each log entry in the WPDT debug plugin displays a Show more button when the stack trace is truncated. Click Show more to expand the full trace inline without leaving the log list.
To open the full file viewer, click the eye icon on the right side of any entry row or use the Q shortcut key. This opens the Error Details panel, which shows the file path, the line number where the error occurred, and the full source file with syntax highlighting. The exact line that triggered the error is highlighted in red.
From the Error Details panel, you can click Jump to Error Line to scroll the source view directly to the offending line. The Error Content dropdown lets you switch between viewing the isolated error call and the full log entry text.
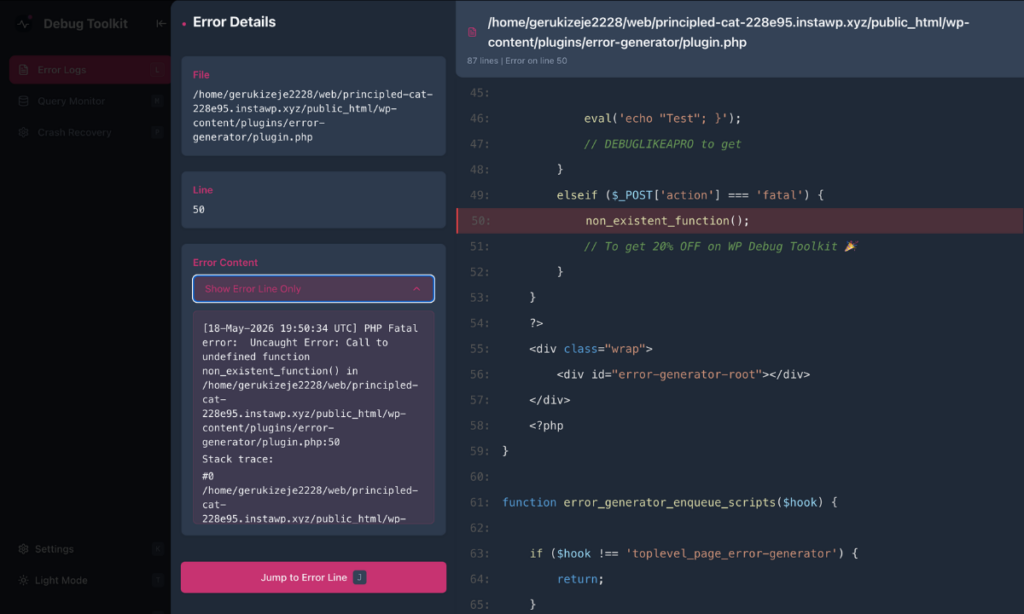
✅What You Should See: The right side of the Error Details panel displays the source file with line numbers. The line that triggered the error is highlighted in red and centered in the view. You can read the surrounding code for context without having to open a code editor or download any files.
WPDT registers its CLI commands under the dbtk namespace. The wp dbtk log command group gives you full access to the error log from the command line, which is useful if you want to set up automated log review in deployment scripts or when you need to pipe output into another tool.
wp dbtk log has three subcommands: read, clear, and stats.
bash
# Read the 50 most recent entries at error and fatal level
wp dbtk log read --level=error,fatal --limit=50

# Read the most recent entries from a specific plugin
wp dbtk log read --plugin=woocommerce --level=error,fatal

# Read entries from the last 5 minutes and return as JSON
wp dbtk log read --since=5m --format=json

# Use +include and -exclude search syntax from the command line
wp dbtk log read --search="+undefined -deprecated"

# Combine filters -- plugin, time window, entry limit
wp dbtk log read --source=plugin --since=1h --limit=200

# Clear the error log (prompts for confirmation)
wp dbtk log clear

# Clear without confirmation -- useful in scripts
wp dbtk log clear --yes

# Show log file path, size, and last modified timestamp
wp dbtk log stats

# Return stats as JSON
wp dbtk log stats --format=json
Below is the full wp dbtk log read flag reference:
| Flag | What It Does |
|---|---|
--level=<levels> | Filter by one or more levels, comma-separated. Accepted values: fatal, error, warning, notice, parse, deprecated. |
--source=<source> | Filter by origin. Accepted values: core, plugin, theme, custom. |
--plugin=<name> | Filter to entries attributed to a specific plugin slug or name. |
--theme=<name> | Filter to entries attributed to a specific theme. |
--since=<timerange> | Filter to entries within a relative time window. Accepted values: 1m, 5m, 15m, 30m, 1h, 6h, 24h, 7d. |
--search=<terms> | Search entry message text using +include and -exclude operators. Matches against the error message line, including its inline file path, but not stack-trace frames or the structured source filter. |
--limit=<n> | Maximum number of entries to return. Defaults to 100. |
--format=<format> | Output format. Accepted values: table (default), json, csv. |
To explore all available subcommands and flags directly from your server:
bash
wp help dbtk log
wp help dbtk log read
Note: Database query log access uses a separate command group, wp dbtk query-log, and is not covered in this article. See the CLI Command Reference for the full query-log subcommand list.
Open the Viewer App settings by clicking Settings in the left sidebar. The panel has three tabs: Debug Constants, Query Settings, and Preferences. The settings relevant to the Error Log Viewer are under Debug Constants and Preferences.
| Setting | What It Does |
|---|---|
WP_DEBUG | Enables WordPress debug mode and surfaces PHP errors, warnings, and notices. Must be on for errors to be generated and captured. |
WP_DEBUG_LOG | Writes debug output to wp-content/debug.log. Enable this alongside WP_DEBUG to populate the log that the Viewer App reads. |
WP_DEBUG_DISPLAY | Shows debug messages on the front end of your site. Keep this disabled on production as it exposes raw PHP errors to your site visitors. |
SCRIPT_DEBUG | Loads unminified versions of CSS and JavaScript files. Enable this when you’re diagnosing front-end issues with theme or plugin assets. |
| Theme Preference | Sets the Viewer App color scheme to Light, Dark, or Auto. Found under Preferences. |
| Remember Sidebar State | Keeps the sidebar collapsed or expanded between sessions. Enable this to preserve your preferred layout across visits. Found under Preferences. |
| Disable IP Binding | Removes the session-to-IP lock on the Viewer App. Enable this if your site sits behind a load balancer or CDN and you’re experiencing session errors after logging in. Found under Preferences. |
Likely cause: No PHP code has executed since you enabled logging, so WordPress has not yet written any entries to debug.log.
Fix: Visit several pages on your site in a browser tab to trigger PHP execution, then return to the Viewer App and refresh. If the log remains empty, confirm that WP_DEBUG and WP_DEBUG_LOG are both enabled. Navigate to WP Debug Toolkit › Overview › Error Logging to check and enable these constants without editing wp-config.php manually.
Likely cause: The log file is missing, unreadable, or has incorrect permissions. The Viewer App reads debug.log directly from disk and does not require WordPress to load, so a WordPress crash alone will not cause this.
Fix: Confirm that debug.log exists at the configured path and that the web server has read permission on the file. If the file is unreadable, the Viewer App clears the log table and displays a red error banner with the specific reason; for example, “Log file is not readable” or “Log file does not exist.” Address the permission or path issue shown in the banner, then reload the Viewer App. Once the file is accessible, the viewer displays current log contents and resumes auto-refreshing every three seconds.
Likely cause: The search term does not match any entry in the current log exactly. The +include operator matches against the full text of each log entry, including file paths, function names, and error messages.
Fix: Broaden your search term. If +my-plugin-name returns nothing, try +my-plugin or a partial directory name. Also, confirm that logging was active when the relevant events occurred, as any entries from before logging was enabled will not appear.
The Viewer App is a separate installation from the WP Debug Toolkit WordPress plugin and is required for the visual log browsing interface. WPDT captures error entries through the WordPress plugin regardless of whether the Viewer App is installed, but browsing, filtering, and expanding stack traces all happen inside the Viewer App.
If the Viewer App isn’t set up yet, you can still read log entries from the command line using wp dbtk log read. The CLI command reads debug.log directly and supports level, source, time range, and search filtering, although CLI search matches against the error message line only, not stack-trace frames. See the Advanced Configuration section for the full command reference.
Yes. The Viewer App operates independently of WordPress and does not require WordPress to load in order to display your error logs. If your site is showing a white screen of death or a fatal error, open the Viewer App directly at its URL. It reads the log file from disk and displays entries regardless of WordPress’s state.
The overhead is negligible on production sites. WPDT reads debug.log directly from disk rather than storing log data in your WordPress database, so enabling error logging adds no database queries to your site’s load.
A WordPress debug log plugin captures PHP errors, warnings, and notices that WordPress writes during page loads and makes them readable and actionable. Without one, those errors sit in a raw debug.log file that you have to download over FTP and scan manually. The WP Debug Toolkit plugin takes things a step further by displaying your log in a structured, filterable interface that updates in real time, groups duplicate entries, and lets you expand any error inline to see the exact PHP line that caused it.
How to Automatically Enable WordPress Debug Mode – Enable WP_DEBUG, WP_DEBUG_LOG, and WP_DEBUG_DISPLAY from the Error Logging management interface without editing wp-config.php directly. Start here if your log is empty and debug mode isn’t confirmed active.
How to Filter and Search WordPress Error Logs – Use +include and -exclude operators to build compound filters and target entries by file path, error message, or function name.
Setting Up the WordPress Error Logs Viewer App – Install the Viewer App, set an access password, and confirm it’s reading the correct log file.
Error Capture and the MU-Plugin – Learn how WPDT captures fatal errors that occur before WordPress finishes loading, and why that matters for the completeness of your error log.