
WP Debug Toolkit (WPDT) automatically analyzes every recorded query for slow execution time, N+1 loop patterns, and duplicate SQL statements at capture time. Access the results in the Query Viewer App using the Slow, Errors, and N+1 filter buttons in the toolbar, each displaying a count badge of flagged queries in the current recording. No manual configuration is required to see detection results, though you can adjust the slow query threshold to match your performance targets.
WPDT’s performance detection system evaluates every query in a recording against three criteria: execution time relative to a configurable threshold, structural repetition patterns indicating N+1 loops, and exact duplication indicating missing object caching.
Detection is precomputed when each query is captured and refreshed when you open a recording, so the slow query threshold applies retroactively. If you lower it after the fact, previously passing queries will appear under the Slow filter on your next open.
When a recording contains hundreds of queries, manual review is not practical. A typical WooCommerce page load can produce 200 to 700 queries, and the ones causing performance problems often look unremarkable in isolation. WPDT’s detection surfaces the problematic queries as filterable categories, so you can go directly to what needs attention rather than scanning the full list.
WP Debug Toolkit delivers the most complete automatic database performance analysis available for WordPress. A single recording session simultaneously identifies slow queries, N+1 patterns, and duplicate queries without requiring any manual inspection. And because slow and N+1 flags are recalculated when you open a recording, adjusting your threshold retroactively surfaces queries that previously passed without re-running anything.
WPDT runs all three detection passes on every query in a recording and exposes each category through a dedicated filter button in the Query Viewer App toolbar. The Slow, Errors, and N+1 buttons each carry a count badge showing how many flagged items the current recording contains.
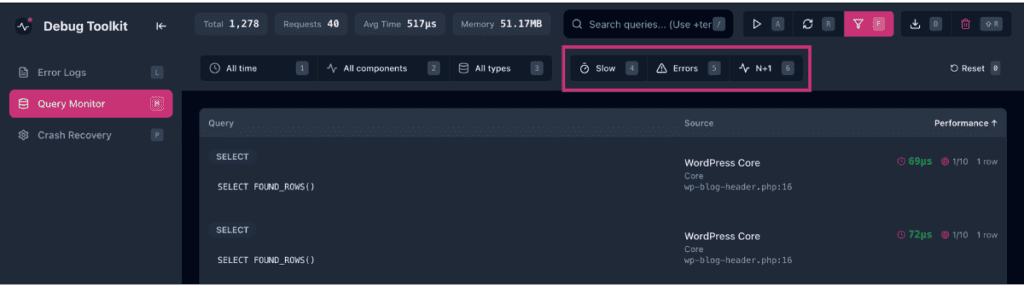
WPDT measures the execution time of every query in milliseconds and records it in the Performance column of the Query Monitor. When a query’s execution time exceeds the configured threshold, WPDT flags it and includes it in the Slow filter set.
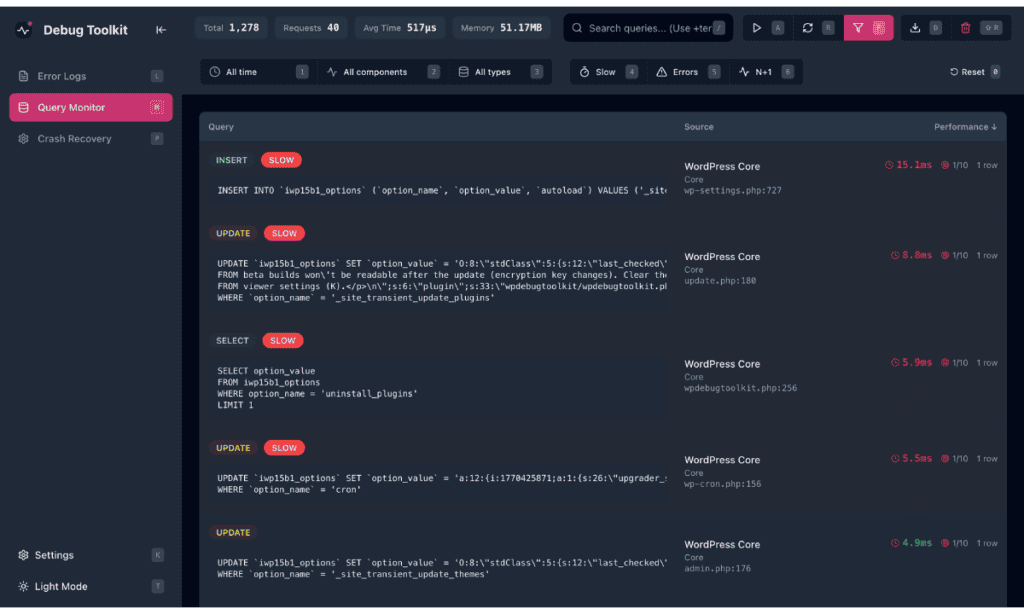
Every query’s timing appears in the Performance column regardless of whether it crosses the threshold, so slow queries stand out visually against the rest of the list.
Complexity Scoring adds a second dimension to this analysis. WPDT assigns each query a score from 1 to 10 based on its structural complexity, independent of how fast it ran on the current dataset.
A query that scores 8 on a staging database with 2,000 posts may run in 2ms. The same query on a production site with 500,000 posts may run in 800ms. The Complexity Score lets you catch architectural problems before they become production incidents.
WPDT displays the Complexity Score as a badge in the Performance column, directly after the execution time value. A query running at 4.5ms with a score of 7/10 shows both pieces of data in the same cell, so you can assess speed and structural risk in a single glance.

The default slow query threshold is 50ms. See Configuration below to change it.
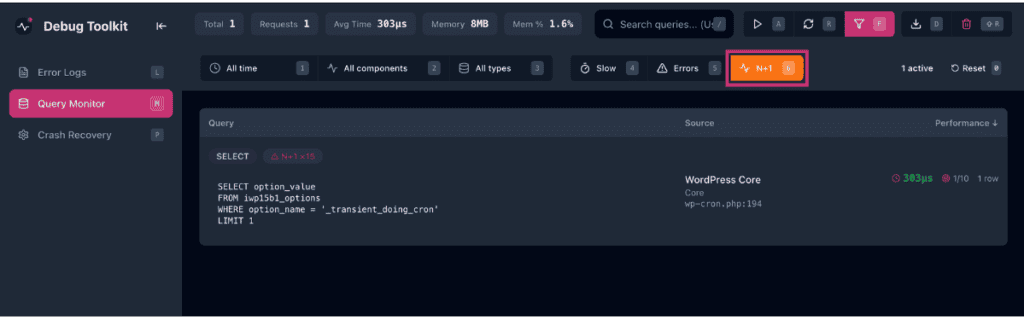
WPDT groups every query in a recording by its exact SQL string and flags any group where the identical statement fires five or more times within a single request. Each flagged query receives a count of how many times that exact statement ran.
The threshold of five is hardcoded. WPDT recalculates the same logic per HTTP request when a recording spans multiple page loads, keeping the scope accurate.
The field name potential_n_plus_1 reflects that this is a heuristic signal rather than proof of a classic ORM-style N+1. An exact repeat count of five or more is a reliable indicator of an inefficient loop, but WPDT does not group by normalized SQL for this detection.
That means the textbook N+1 pattern, where the same query structure fires with a different ID each time (WHERE id = 1, WHERE id = 2, WHERE id = 3), does not appear under the N+1 filter. Those queries have different raw SQL strings and instead surface under duplicate detection through normalized matching. See Duplicate Query Detection below.
WPDT uses backtrace analysis for component attribution only. Stack traces identify which plugin, theme, or core component generated a query and appear in the Source column. They are not an input to N+1 detection.
WPDT’s backend computes normalized duplicate groups for every recording. It collapses whitespace and replaces literal values with ? before comparing, so WHERE id = 1 and WHERE id = 2 resolve to the same normalized form and count toward the same group.
WPDT stores these groups and uses them to calculate impact scores and recommendations. They also appear in WP-CLI output via wp dbtk query-log read –summary, which reports the count of duplicate groups per page load.
This normalized duplicate data does not surface as a dedicated filter or badge in the Query Monitor viewer UI. In the viewer, repeated queries appear through the N+1 detection path.
When an identical SQL statement fires five or more times in a single request, WPDT marks each matching row with an inline ⚠ N+1 ×{count} badge and includes it in the N+1 filter set. Expanding a flagged row shows an “N+1 Query Pattern Detected” callout with the execution count.
The practical consequence is a classic variable-per-row loop, where each iteration produces a different SQL string (such as WHERE post_id = 1, WHERE post_id = 2) that will appear in the backend duplicate groups but will not trigger the N+1 badge in the viewer, because each raw SQL string is unique.
In essence, the N+1 filter catches exact repetition while the normalized duplicate analysis informs scoring and CLI output. These are separate code paths with separate outputs.
✅ Key Guarantees
| Term | What It Means |
|---|---|
| Slow Query Threshold | The configurable execution time limit above which WPDT flags a query as slow. The default is 50ms. Queries exceeding this threshold appear under the Slow filter in the Query Monitor. Configure it in the WP Debug Toolkit Viewer under Settings › Query Settings › Slow Query Threshold. |
| N+1 Pattern | An identical SQL statement that fires five or more times within a single request. WPDT groups queries by exact SQL string and applies a hardcoded threshold of five occurrences to flag a potential loop. Queries with the same structure but different literal values (such as WHERE id = 1, WHERE id = 2) produce different raw SQL strings and do not meet this definition. |
| Duplicate Query | A query whose normalized SQL (whitespace collapsed, literal values replaced with ?) matches one or more other queries in the same recording. WPDT computes these groups in the backend and uses them for impact scoring and CLI summaries. Running wp dbtk query-log read –summary reports the count of duplicate groups per page load, not the group contents. This data does not appear as a dedicated filter in the viewer UI. Repeated queries visible in the viewer are surfaced through N+1 detection instead. |
| Complexity Score | A 1-to-10 score WPDT assigns to each query based on its structural complexity. The score appears as a badge in the Performance column, directly after the execution time value. A high score on a small dataset can indicate a query that will become a performance bottleneck as the database grows. |
| Component Attribution | Backtrace-based analysis that identifies which plugin, theme, or WordPress core component generated each query. Surfaces in the Source column of the Query Monitor and enables component-level filtering via the All components dropdown. Stack traces are not an input to N+1 detection. |
N+1 detection, duplicate detection, and Complexity Scoring are automatic and require no configuration. The only detection-related setting you may need to adjust is the slow query threshold.
Step 1: Open the WP Debug Toolkit Viewer and press K to open Debug Toolkit Settings. Select the Query Settings tab.
Step 2: Enter your desired value in the Slow Query Threshold field. The field accepts milliseconds and defaults to 50. Select Save Settings to apply the change.
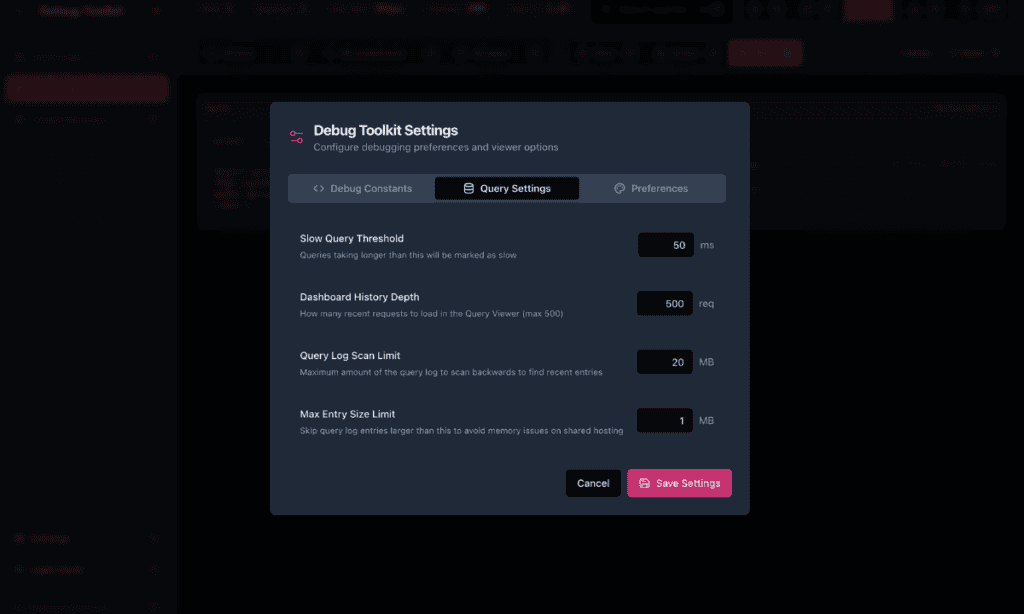
Likely cause: the slow query threshold is set too high, so queries that are slow in practice do not cross it.
Fix: open the WPDT Query Viewer App, press K to open Debug Toolkit Settings, and select the Query Settings tab. Lower the value in the Slow Query Threshold field and select Save Settings. Queries that previously fell below the threshold will now appear under the Slow filter.
Likely cause: WPDT’s N+1 detection groups by exact SQL string. If a loop fires the same query structure with a different parameter each time (such as WHERE post_id = 1, WHERE post_id = 2), each iteration produces a different raw SQL string and the five-occurrence threshold is never met for any single string.
Fix: this type of loop surfaces in the backend duplicate groups and in wp dbtk query-log read –summary output rather than as an N+1 badge in the viewer. Check the Source column to identify which component generated the queries and trace the loop back to its origin.
Detection is automatic. Every recording WPDT captures is analyzed for N+1 patterns, duplicate queries, and slow queries without any configuration required. The slow query threshold is adjustable, but pattern and duplicate detection run on every recording regardless of that setting.
The N+1 filter flags queries whose exact SQL string repeats five or more times in a single request. Duplicate detection uses normalized SQL, replacing literal values with ? before comparing, so queries with the same structure but different parameters are grouped together. That data feeds impact scoring and CLI output, but does not appear as a dedicated filter in the viewer. The practical consequence: a variable-per-row loop where each iteration uses a different ID will show up in the backend duplicate groups, not under the N+1 filter.
Yes. WPDT uses backtrace analysis to attribute each query to its originating plugin, theme, or WordPress core component and surfaces this in the Source column. Filter by Slow to isolate slow queries, or by N+1 to isolate exact-repeat patterns, then check the Source column to identify which component generated them. Use the All components dropdown to narrow the entire view to a single component across all query types.
Recording WordPress Database Queries – Start here if you haven’t captured a recording yet. Detection analysis has nothing to work with until a recording is active and queries are flowing in.
Filtering and Searching Recorded Queries – Once detection flags something, this is how you narrow 600 queries down to the three that matter.
How to Diagnose Slow Database Queries – The end-to-end walkthrough for identifying the cause of a slow site, using the detection features covered in this article.
