
To isolate specific errors in WP Debug Toolkit’s (WPDT) Error Logs view, type a search term into the search bar using the +include or -exclude operator syntax, and use the filter dropdowns (All levels, All time, All sources, and All plugins, plus All themes when themes appear in the log) to narrow results by attribute. Combine both mechanisms to reduce a noisy log to only the entries relevant to what you are investigating.
WPDT’s Error Logs view provides two independent filtering mechanisms that work together. The search bar accepts free-text operators that include or exclude entries by string. The filter row beneath the search bar provides four dropdown controls that narrow entries by attribute. Each mechanism applies independently, and you can run both simultaneously.
This guide assumes the Viewer App is installed and you are viewing the Error Logs with at least one log entry present. If you have not set up the Viewer App yet, start with Setting Up the WordPress Error Logs Viewer App before continuing. If your Error Logs view is empty in WP Debug Toolkit › Overview › Error Logging under Debug Constants, enable Debug Mode and Error Logging, then trigger the behavior you want to capture and return here.
The search bar sits at the top of the Error Logs view. You can press / from anywhere in the viewer to jump the cursor directly into the search bar.
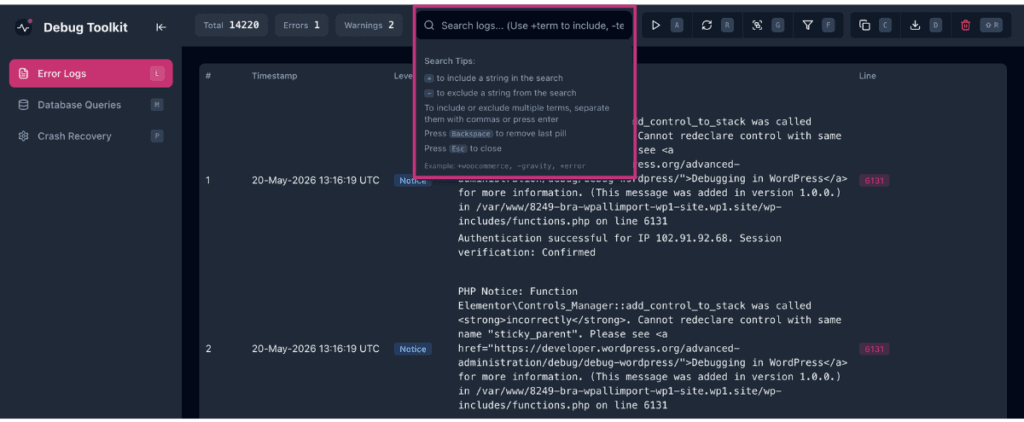
To show only entries from a specific plugin, type +plugin-name into the search bar. To hide entries containing a specific string, type -string. Press Enter or type a comma after each term to commit it as a chip.
The filter applies only to committed chips, so text you are still typing has no effect. To combine operators, commit each as its own chip. For example, if you type +woocommerce and press Enter, then type -deprecated and press Enter, the search results include WooCommerce entries and exclude anything containing “deprecated.”

The header counts update immediately after you commit each term. Press Esc to clear the search and return to the full view.
✅ What You Should See: The entry list narrows to entries matching your search. The Total count in the header reflects the filtered set, not the full log.
| Search | What It Finds |
|---|---|
| fatal | Entries containing “fatal” anywhere |
| +elementor, +database | Entries containing either “elementor” or “database” |
| +timeout, -cron | Timeout errors not related to cron |
| class-wc-order | Entries mentioning the WooCommerce order class file |
Click the F filter icon in the toolbar to reveal the four filter dropdowns below the search bar.
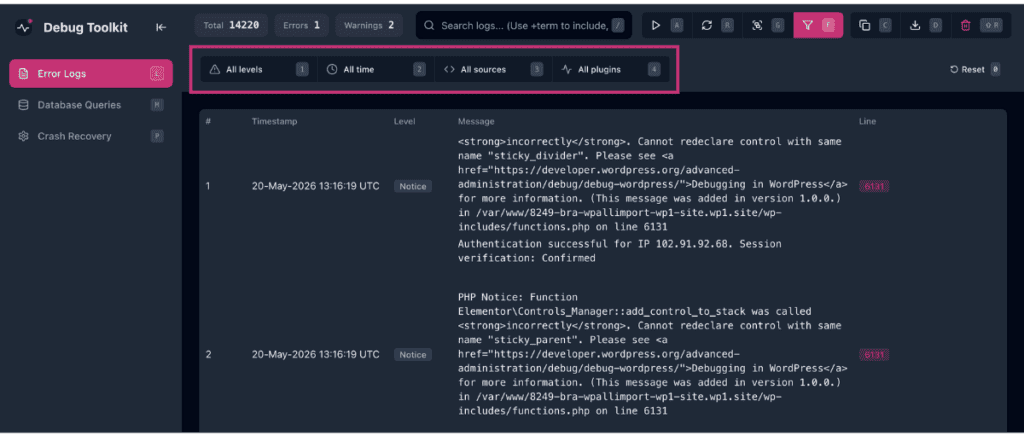
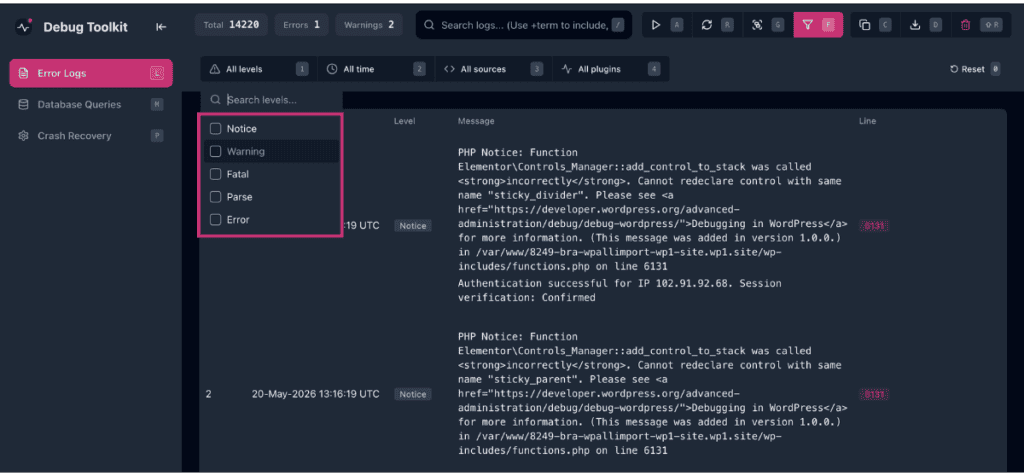
Click All levels to filter by error level. The dropdown lists five options: Notice, Warning, Fatal, Parse, and Error.
Click All time to filter by time range. Available ranges are All time, Last minute, Last 5 minutes, Last 15 minutes, Last 30 minutes, Last hour, Last 6 hours, Last 24 hours, and Last 7 days.
Click All sources to narrow by code origin. Source options are WordPress Core, Plugins, Themes, and Custom, where Custom covers errors from mu-plugins or custom code directories.
Click All plugins to narrow entries to a specific plugin. The list populates dynamically from file paths in the log data, so it reflects what has actually generated errors rather than all installed plugins.
Click All themes to narrow entries to a specific theme. This option only appears when a theme generates an error. The theme list populates the same way as the plugin list, from file paths present in the log data.
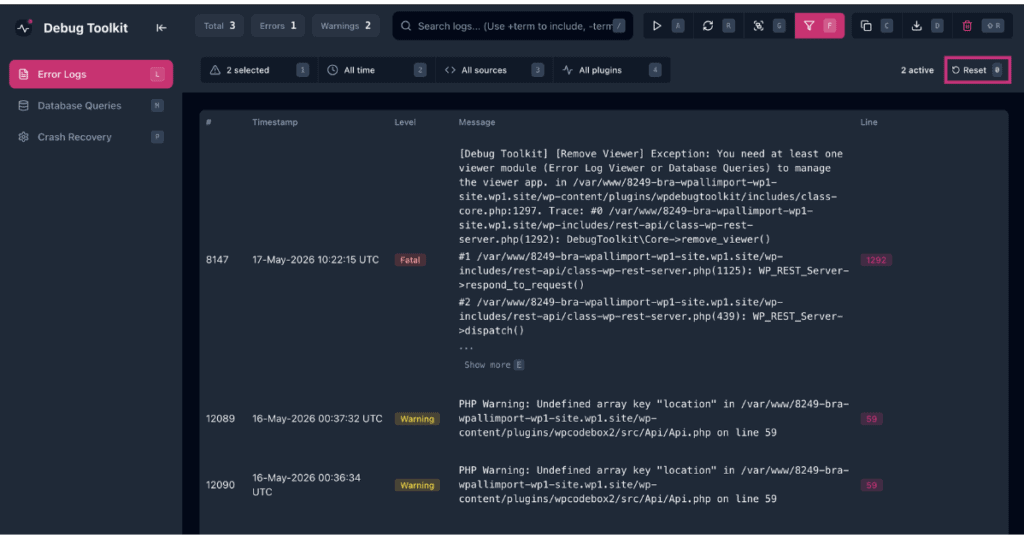
Click the Reset button at the right end of the filter row to clear all active dropdown selections and return to the full log view. You can also press 0 while the filter panel is open to reset all filters to their defaults. Neither Reset nor 0 affects the search bar. Press Esc to clear the search bar separately if a search term is still active.
✅What You Should See: The entry list returns to all entries that match any remaining active controls. When one or more filters are active, an “{N} active” pill appears next to the Reset button, indicating how many filters are applied. The Reset button itself shows 0, its keyboard shortcut.
Set the filters and search operators that define the data you want to export. The export captures the current filtered view, not the full log.
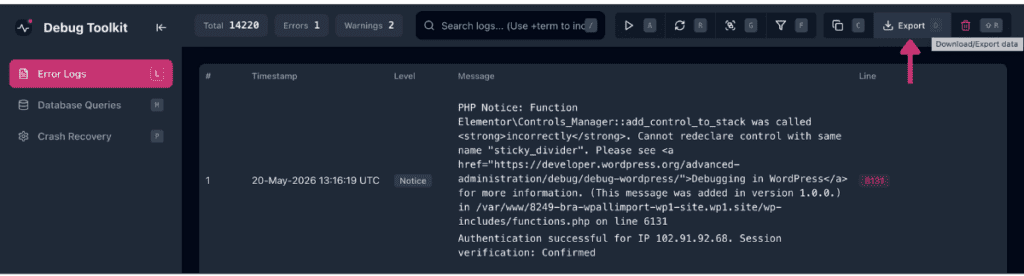
Click the Export button in the toolbar to download/export your error log data.
⚠️Warning: The Clear button sits next to the Export button in the toolbar. Clicking Clear permanently deletes log entries. Take extra precaution not to press the wrong button.
If you set ‘Level: Error’ and ‘Source: Plugins’ and then search for +stripe, it tells the viewer to show only error-level entries from plugins that mention “stripe.” No entry reaches the list unless it satisfies every active filter and the search term simultaneously. This combination is the fastest way to isolate a specific problem when you know both its origin and a keyword likely to appear in the message.
The wp dbtk log read command exposes the full filtering surface of the Error Logs view from the command line. Every dropdown and search operator available in the viewer has a CLI equivalent.
bash
# Filter by error level -- comma-separate multiple levels, no spaces
wp dbtk log read --level=error
wp dbtk log read --level=fatal,error

# Filter by source type
wp dbtk log read --source=plugin     # core, plugin, theme, or custom
wp dbtk log read --source=core

# Filter by plugin -- substring match against the file path, case-insensitive
wp dbtk log read --plugin=woocommerce
wp dbtk log read --level=error --plugin=acf

# Filter by theme
wp dbtk log read --theme=twentytwentyfour

# Filter by time range -- mirrors the All time dropdown in the viewer
wp dbtk log read --since=5m          # 1m, 5m, 15m, 30m, 1h, 6h, 24h, 7d
wp dbtk log read --since=1h --level=warning

# Filter by message text -- same +include/-exclude operators as the search bar
wp dbtk log read --search="+undefined -deprecated"

# Combine flags for precise results
wp dbtk log read --since=30m --source=plugin --plugin=elementor --level=error,fatal --format=json

# Control output volume and format
wp dbtk log read --limit=50          # default is 100; applies after all filters
wp dbtk log read --level=fatal --limit=50 --format=json   # table, json, or csv
Three behaviors are worth knowing before you rely on output. First, --limit caps the count of parsed, filtered entries. It is not a raw line count.
Second, reading always starts from the tail of the file, so very old entries outside the tail window may not appear even without --since.
Third, --plugin matches anywhere in the source path string, not against a strict plugin slug, so a partial name like acf matches advanced-custom-fields and any other path containing that substring.
For the full flag reference on your install, run wp help dbtk log read.
Likely cause: The search term does not match the exact string as it appears in the log entry.
Fix: Broaden the search term, or open a log entry and read its exact wording before applying the + operator. Searching without an operator prefix first confirms that the string exists in the log before you narrow it.
Likely cause: A search term remains active in the search bar. The search bar and the filter dropdowns are independent controls. Clicking Reset clears all dropdown selections but does not affect the search bar.
Fix: Manually clear the search bar after clicking Reset.
Yes, but the logic differs between the Viewer app and WP-CLI. In the Viewer, multiple + terms use OR logic. Commit +woocommerce and +fatal as two separate chips, and the Viewer returns any entry containing either word. In WP-CLI, multiple include terms use AND logic. --search= "+woocommerce +fatal" returns only entries containing both words. Exclude terms work the same way on both: any single -term match drops the entry. Matching is case-insensitive on both. There is no limit on the number of operators you can combine.
Neither. WPDT gives you a dedicated toggle for deduplication. Press G in the viewer to activate grouping. When grouping is enabled, identical entries collapse into a single row that shows a repeat count (×259, for example) and the timestamp of the first occurrence. Press G again to return to the ungrouped view. Grouping is off by default, so a log showing thousands of entries will collapse significantly the first time you activate it.
How to Use the Error Log Viewer in WordPress – New to the viewer? Start here for a full walkthrough of the Error Logs view, including the toolbar, header counts, and how to navigate entries.
How to Use the File Viewer – Once you’ve found the entry you’re looking for, expand its stack trace and read the exact PHP file and line number that triggered it, without leaving the viewer.
How to Export WordPress Error Logs – Filtered your log down to the entries that matter? Export them as a file to share with a client or pick apart offline.