
Always-on logging is a persistent query capture mode in WP Debug Toolkit (WPDT) that writes a log entry for every SQL query on every incoming request, with no defined start or stop point. Enable it from WP Debug Toolkit › Overview in the Developer Settings section of the Database Queries card. Use this mode only in development environments, as it generates significant disk I/O on sites with active traffic.
Always-on logging is a persistent query capture mode. Unlike the recording mode, which captures queries only within a defined time window, always-on logging writes a log entry for every SQL query on every incoming request from the moment you enable it until you explicitly disable it. There is no timer, countdown, or automatic stop.
Certain bugs only reproduce under specific conditions. For example, a cron job that runs at 3 a.m. or a query pattern that occurs during a specific user workflow. A manual recording session requires you to be present at the right moment.
Always-on logging removes that constraint by keeping the logger continuously active, so queries from any request, whether foreground or background, land in the log file.
WP Debug Toolkit’s Always-On Logging mode is built to run on live sites. Rather than writing to disk on every query, WPDT accumulates query data in memory during the request and flushes it in a single write at shutdown, minimizing I/O impact. On virtually all modern PHP installations, that data is encrypted before it reaches disk
The Database Monitor supports two query capture approaches. Understanding the mechanism behind each one tells you which to reach for and when.
Recording mode captures queries only during a session window you define, from 10 seconds to one hour. When the timer expires, or you stop the recording manually, query capture stops, and WPDT writes no further data to disk.
Always-on logging, on the other hand, captures queries for every request from the moment you enable it until you explicitly disable it.
Both modes write to the same encrypted file store at wp-content/uploads/debug-toolkit/queries/, organized by month, and both modes add zero database overhead because WPDT writes to disk files rather than the WordPress database.
The difference is in volume and duration. Recording writes data for a bounded window, while always-on logging writes data continuously.
On a high-traffic site receiving hundreds of requests per minute, always-on logging generates thousands of log entries per hour. That kind of volume creates significant disk I/O and storage consumption, which is why this is a development tool rather than a production monitoring strategy.
See Recording WordPress Database Queries for full instructions on starting and stopping time-limited sessions.
Query capture with the db.php drop-in requires WPDT to enrich each query with backtrace and component data as it executes. At the end of the request, WPDT collects all queries from $wpdb->queries, analyzes them, and writes a single encrypted JSON line to disk on the WordPress shutdown hook. On a low-traffic development site, that overhead is negligible.
However, on a production site with concurrent requests, the cumulative disk I/O from capturing every query on every request can measurably affect server response times.
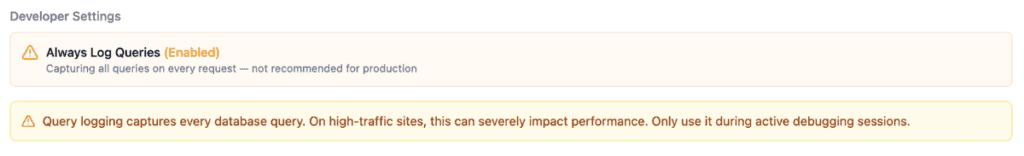
This is why WPDT displays a performance warning whenever any query logging option is active: “Query logging captures every database query. On high-traffic sites, this can severely impact performance. Only use it during active debugging sessions.”
The warning appears for basic and enhanced logging as well as always-on mode, but the cost it describes scales with traffic and request volume. On a site where always-on logging captures hundreds of requests per hour, that cost is real and measurable.
✅Key Guarantees
| Term | What It Means |
|---|---|
| Always-On Logging | The persistent query capture mode in WPDT. Captures every SQL query on every request with no defined window. Enable it via the Always Log Queries setting in the Developer Settings section of the Database Queries card at WP Debug Toolkit › Overview. |
| Recording Mode | The time-limited capture mode. Captures queries only within a session window of 10 seconds to one hour, then stops when the timer expires, or you stop it manually. The recommended approach for most debugging sessions. |
| Always Logging (status) | The amber status indicator displayed on the Database Queries card when always-on logging is active. Serves as a persistent visual reminder that continuous query capture is running. |
| Disk I/O | The read and write operations the server performs during query logging. On high-traffic sites with always-on logging active, the volume of disk writes can measurably increase server load and extend response times. |
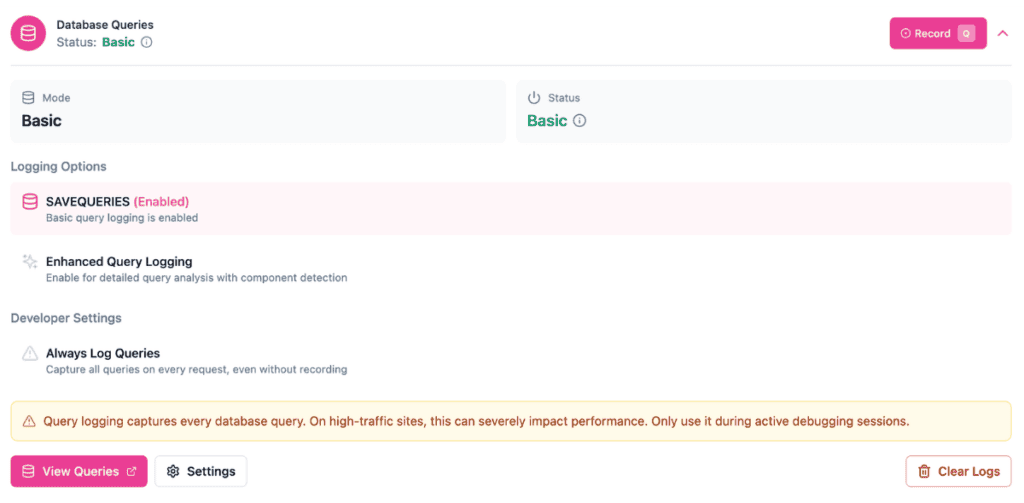
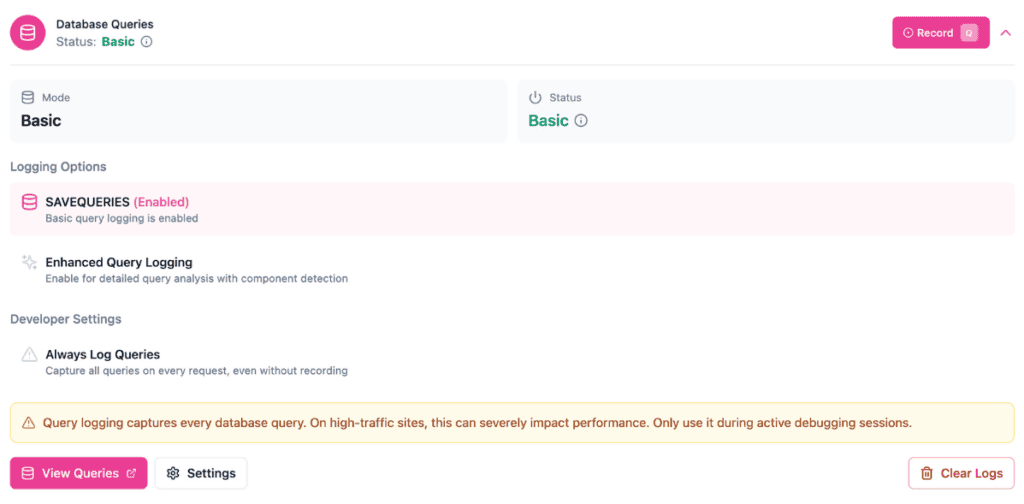
Go to WP Debug Toolkit › Overview and locate the Database Queries card. Expand it to reveal the Developer Settings section.
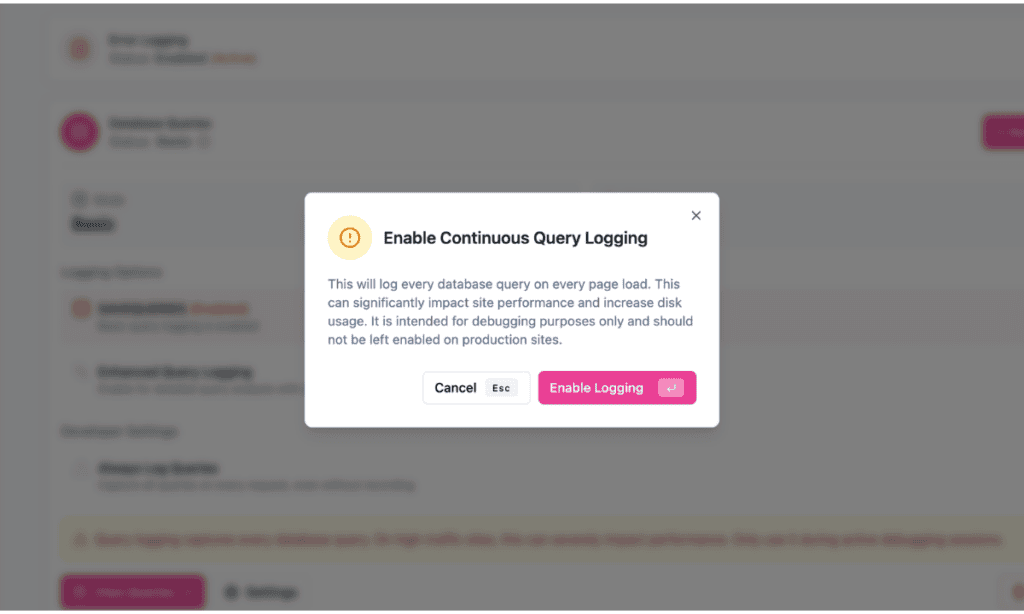
Click the Always Log Queries row in the Developer Settings section. WPDT displays a confirmation modal titled Enable Continuous Query Logging with a warning.
Click Enable Logging to confirm (or press Enter). Click Cancel or press Esc to abort.
After you confirm, the Always Log Queries row updates to show (Enabled) in an amber variant. The card-level status field also updates to Always Logging in amber.
✅ What You Should See: The Database Queries card header shows Status: Always Logging in amber. The Always Log Queries row in Developer Settings shows (Enabled) in an amber variant. The performance warning remains visible below the Developer Settings section.
How you disable always-on logging determines what state the Database Queries card returns to. Two paths exist, and they produce different results.
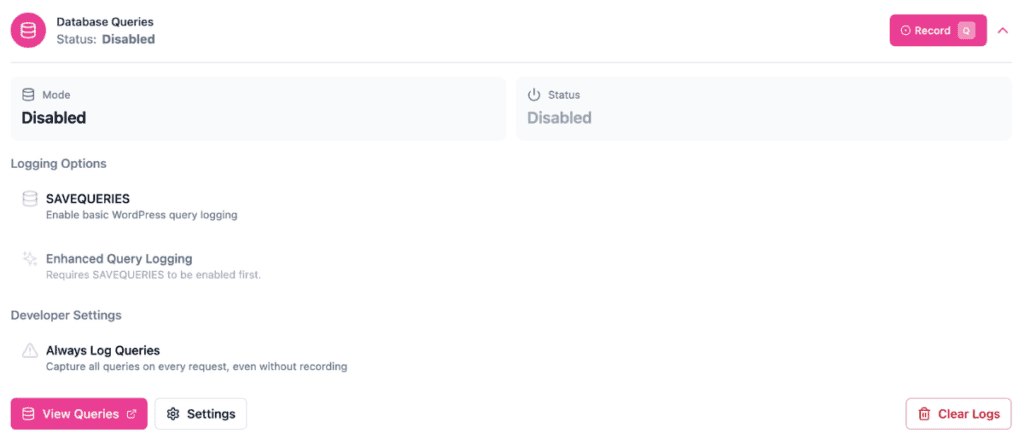
To disable all query logging entirely: Click the Always Log Queries row again. WPDT turns off all query logging. The card updates to Mode: Disabled and Status: Disabled. Both SAVEQUERIES and Enhanced Query Logging deactivate along with always-on logging.
To disable always-on logging but keep basic logging active: Click the Enhanced Query Logging row to disable it. WPDT drops the card to Mode: Basic and Status: Basic, with SAVEQUERIES remaining enabled. Always-on logging deactivates as part of this change, and Enhanced Query Logging reverts to its inactive state.
✅ What You Should See: After disabling, the Database Queries card header no longer shows Always Logging in amber. The status reads either Disabled (if you clicked Always Log Queries) or Basic (if you clicked Enhanced Query Logging). The Always Log Queries row in Developer Settings shows no enabled state in either case.
Do not leave always-on logging active on any site receiving real user traffic.
Likely cause: Always-on logging generates significant disk I/O on every request, and the impact compounds with traffic volume.
Fix: Disable Always Log Queries immediately at WP Debug Toolkit › Overview and switch to a time-limited recording session instead. Always-on logging is intended for development environments only.
Likely cause: Always-on logging was left active longer than intended; overnight, across a weekend, or during a period of higher-than-expected traffic. Even on a moderately active site, continuous query capture accumulates data rapidly because every request writes to disk, regardless of whether a recording session is open.
Fix: Navigate to WP Debug Toolkit › Settings › Log Cleanup and review the retention settings for query logs. Set a maximum age and a size cap to prevent the wp-content/uploads/debug-toolkit/queries/ directory from growing unchecked. After adjusting retention settings, disable Always Log Queries at WP Debug Toolkit › Overview if you no longer need continuous capture.
Yes, with awareness of the storage impact. Staging sites typically have lower traffic than production, so the disk I/O impact is manageable. Monitor the log file size at wp-content/uploads/debug-toolkit/queries/ and configure log rotation via the Log Cleanup tab to prevent the directory from growing unchecked.
No. WPDT writes query data to encrypted flat files on disk rather than to the WordPress database. Always-on logging adds disk I/O but adds zero database overhead regardless of how much data it captures. The performance warning in the admin UI refers to disk I/O and server load, not database performance.
The WordPress SAVEQUERIES constant stores query data in memory for the current page load only. That data disappears when the request ends. WPDT’s always-on logging writes encrypted query data to disk on every request, so it persists across page loads and remains accessible in the Query Viewer. WPDT uses SAVEQUERIES internally in basic mode, but enhanced mode (via the db.php drop-in) captures more data and writes it persistently, whether in recording mode or always-on mode.
Recording Queries – Always-on logging is the exception. This is the mode you should be using most of the time.
Query Log Rotation and Retention – Always-on logging fills disk fast. Set this up before you forget it’s running.
The db.php Drop-in – Understand what WPDT installs to intercept queries, and what breaks if another plugin touches it.