
To enable WordPress debug mode using WP Debug Toolkit (WPDT), navigate to WP Debug Toolkit › Overview and toggle the debug constants you need. WPDT writes each change to wp-config.php immediately, with no FTP access and no manual file editing required. The same constants are also available in the Viewer App’s Settings panel and from the command line using wp dbtk debug on.
WordPress uses PHP constants defined in wp-config.php to control how your site handles errors. These constants determine whether errors are reported at all, where they are written, and whether they appear on-screen for visitors.
WP Debug Toolkit provides toggle switches, CLI commands, and a standalone Viewer App panel to manage all of them without manually editing any files.
The constants do not work independently. WP_DEBUG is the master switch, and when it is set to false, WP_DEBUG_LOG and WP_DEBUG_DISPLAY have no effect regardless of their own values.
SAVEQUERIES is also dependent on WP_DEBUG being true in most configurations. Getting the right combination of constants active for your environment is the core task this article covers.
WP_DEBUG Constants Work in WP Debug ToolkitWPDT manages the constants directly in wp-config.php using the admin dashboard, CLI, and Viewer App. The admin and CLI paths share a safe write process with two properties worth knowing before you start:
wp-config.php the first time it writes to it. Changes are applied by writing to a temporary file first, then atomically renaming it into place. This way, the live file is never left in a partially written state.wp-config.php using file locking, without the temporary-file-and-rename approach that the admin and CLI use, and also without creating a backup first.WP_DEBUG Constants from the Admin DashboardNavigate to WP Debug Toolkit › Overview in your WordPress admin. The Overview page displays cards for Database Queries, Error Logging, and Email Notifications, along with the debug constant toggles.
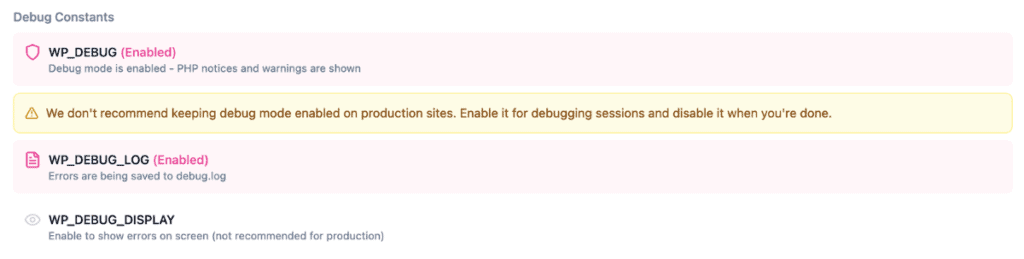
The four toggles are available directly on the Overview page. Each toggle is labeled with its constant name and a short description of what it controls:
| Constant | What It Controls |
|---|---|
WP_DEBUG | Master switch for WordPress debug mode. It enables PHP error reporting |
WP_DEBUG_LOG | Writes errors to wp-content/debug.log |
WP_DEBUG_DISPLAY | Shows errors directly in the browser |
SAVEQUERIES | Records database queries in memory during each page load |
For production debugging, toggle WP_DEBUG and WP_DEBUG_LOG to ON. Leave WP_DEBUG_DISPLAY toggled OFF. WPDT writes each change to wp-config.php immediately.
⚠️ Warning: Enabling Display Errors on a publicly accessible site exposes internal file paths, database details, and code structure to anyone visiting the site. It’s best to keep this toggled OFF on any production environment.
✅ What You Should See: The toggle states update immediately to reflect the current values in wp-config.php. WPDT creates a one-time backup of wp-config.php the first time it writes to it.
The Viewer App is a standalone application installed separately from the WP Debug Toolkit WordPress plugin. Its Debug Constants panel provides the same toggle controls as the admin dashboard, but operates independently of WordPress. This ensures it is available when WordPress is unresponsive, returns a white screen, or is unable to load the admin.
Navigate to your Viewer App URL and log in with your credentials.
Press K to open the Settings panel and locate the Debug Constants section. It displays the four constants available in the admin dashboard, plus SCRIPT_DEBUG, which is only controllable from the Viewer App panel.
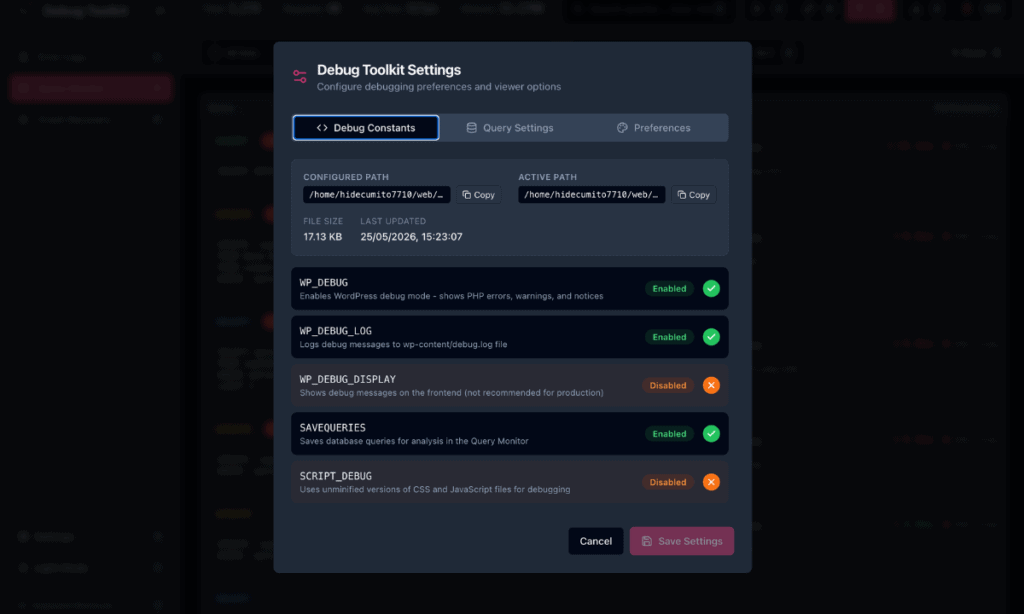
Toggle the constants as needed. Changes apply through the viewer’s API without loading WordPress.
✅ What You Should See: The toggle states update and WPDT confirms the change was written to wp-config.php. The Viewer App writes directly to the file with a lock, so have a backup of wp-config.php available before making changes from here, particularly on production.
WP_DEBUG Constants via WP-CLIWPDT registers wp dbtk debug commands for managing debug constants from the terminal.
bash
# Enable WP_DEBUG and WP_DEBUG_LOG (does not enable WP_DEBUG_DISPLAY)
wp dbtk debug on

# Also enable WP_DEBUG_DISPLAY -- use on development or staging only
wp dbtk debug on --display

# Disable WP_DEBUG, WP_DEBUG_LOG, and WP_DEBUG_DISPLAY
wp dbtk debug off

# Check the current value of every debug constant
wp dbtk debug status

# Output as JSON for use in scripts
wp dbtk debug status --format=json
Running wp dbtk debug status outputs a table showing the current value of each constant, along with the state of enhanced query logging and the active debug log file path:
+--------------------+-----------------------------------+
| Setting            | Value                             |
+--------------------+-----------------------------------+
| WP_DEBUG           | ON                                |
| WP_DEBUG_LOG       | ON                                |
| WP_DEBUG_DISPLAY   | OFF                               |
| SAVEQUERIES        | OFF                               |
| Enhanced logging   | OFF                               |
| Log path           | /var/www/html/wp-content/debug.log|
+--------------------+-----------------------------------+On production, enable WP_DEBUG and WP_DEBUG_LOG so errors are captured to the log file, but keep WP_DEBUG_DISPLAY off so visitors never see raw PHP output. On staging and development, enable all three to surface errors immediately in the browser during testing.
| Environment | WP_DEBUG | WP_DEBUG_LOG | WP_DEBUG_DISPLAY |
|---|---|---|---|
| Production | true | true | false |
| Staging | true | true | true |
| Development | true | true | true |
| Constant | What It Does |
|---|---|
WP_DEBUG | The master switch for WordPress debug mode. When true, WordPress reports all PHP errors, notices, and warnings instead of suppressing them. The other debug constants have no effect unless this is true first. |
WP_DEBUG_LOG | Writes all PHP errors to a log file. When set to true, errors go to wp-content/debug.log. Set it to a string path to log to a different location. WPDT reads this log in the Error Log Viewer. |
WP_DEBUG_DISPLAY | Shows raw PHP error messages directly in the browser. Set to false on any publicly accessible environment as leaving this true on production exposes file paths, database details, and code structure to visitors. |
| SAVEQUERIES | Stores every database query in memory during each page load in the $wpdb->queries array. Adds memory overhead proportional to query count, which is measurable on high-query pages. WPDT uses this for basic query logging. |
SCRIPT_DEBUG | Uses unminified versions of CSS and JavaScript files. Enable when troubleshooting front-end asset issues in themes or plugins. Only available from the Viewer App’s Debug Constants panel, it does not appear in the admin dashboard toggles. |
WPDT detects GridPane automatically. GridPane sites include a secure-debug.php file that defines debug constants separately from wp-config.php.
Rather than writing to secure-debug.php, WPDT writes its constants directly into wp-config.php using the wrapped if ( ! defined(...) ) format, which ensures WPDT’s values take precedence over whatever secure-debug.php defines.
No additional configuration is needed: the admin toggles, Viewer App panel, and WP-CLI commands all work identically on GridPane as on standard hosting.
WP_DEBUG Is On but No Errors Appear in debug.logLikely cause: WP_DEBUG_LOG is not enabled. WP_DEBUG enables error reporting, but without WP_DEBUG_LOG, WordPress does not write errors to a file.
Fix: Toggle Error Logging to enable it at WP Debug Toolkit › Overview, or run wp dbtk debug on.
WP_DEBUG_LOG Is On but the Log File Is EmptyLikely cause: No PHP errors have occurred since logging was enabled, or the log file is at a non-standard path and WPDT is reading a different location.
Fix: Trigger a page load on the site, then check WP Debug Toolkit › Settings › Viewer Settings › File Paths Configuration to confirm the debug log path WPDT resolves matches where WordPress is actually writing errors.
WP_Debug Constants — Frequently Asked QuestionsWP_DEBUG slow down my WordPress site?Enabling WP_DEBUG alone adds minimal overhead. WordPress reports errors it normally suppresses, but the performance cost is negligible. Enabling SAVEQUERIES adds memory cost proportional to the number of database queries per page load, which is measurable on complex pages. Keep SAVEQUERIES off on production unless you are actively analyzing query data.
wp-config.php manually?Yes. Navigate to WP Debug Toolkit › Overview and use the toggle switches. WPDT writes the change directly to the wp-config.php file, creates a one-time backup the first time it writes to the file, and confirms the new state immediately. You do not need FTP access or manual file editing for this.
WPDT manages the constants; it does not replace them. The constants still live in wp-config.php and work exactly as WordPress has always used them. WPDT provides the interface to set them without manually editing the file, with the Viewer App and WP-CLI as additional management surfaces.
Disable it immediately by toggling WP_DEBUG_DISPLAY to OFF at WP Debug Toolkit › Overview, or run wp dbtk debug off followed by wp dbtk debug on to re-enable only WP_DEBUG and WP_DEBUG_LOG without display.
How to Safely Modify wp-config.php – See how WPDT protects every wp-config.php change with atomic writes, automatic backups, and rollback on failure.
How to Use the WordPress Error Log Viewer – Once WP_DEBUG_LOG is on, this is where your errors go. Learn how to filter, search, and read them in the structured log viewer.
How to Automatically Enable WordPress Debug Mode – New to WPDT debugging? Start here to enable WP_DEBUG, trigger your first error, and confirm the log is capturing output end to end.