
The File Viewer surfaces inline stack traces and code context directly inside the Error Logs view of the WP Debug Toolkit (WPDT) Viewer App. You can expand any entry to see the full call chain that produced the error: the file path, the exact PHP line, and the surrounding code context, all inline inside the Viewer App. The File Viewer eliminates the round-trip to an FTP client or code editor, so you trace any error to its source in seconds.
The File Viewer is the inline stack trace and code context display built into the Error Logs view of the WP Debug Toolkit Viewer App. When you expand a log entry, WPDT renders the full call chain that led to the error. Each stack trace frame shows the file path, the line number, and the function or method that ran, in sequence from the error origin outward.
The standard alternative to this is slow. You read the error message, copy the file path, open an FTP client or SSH session, locate the file on the server, and navigate to the line number.
The File Viewer collapses that entire sequence by ensuring that the stack trace, the originating file, and the surrounding code context all appear directly inside the log entry. This lets you move from error message to source line without having to leave the viewer.
Because the Viewer App reads files from disk independently of WordPress, the code it displays reflects the current file state with no database query and no cache layer between you and the source.
WP Debug Toolkit’s File Viewer closes a gap that every other WordPress debugging tool leaves open. The moment you have a stack trace entry, you can navigate directly to the source file at the exact line number, without switching tools, opening an editor, or leaving the Viewer App.
When you expand a log entry, the Viewer App parses the stack trace data and renders the full call chain directly inside that row rather than routing you to a separate page or panel.
This guide assumes that you have installed the Viewer App and can see entries in the Error Logs view. If you haven’t done that yet, start with Setting Up the WordPress Error Logs Viewer App before continuing.
Navigate to your Viewer App URL and log in. The Error Logs interface is opened by default.
The view loads your log entries in a table with five columns: #, Timestamp, Level, Message, and Line. The header bar shows the current Total, Errors, and Warnings counts.
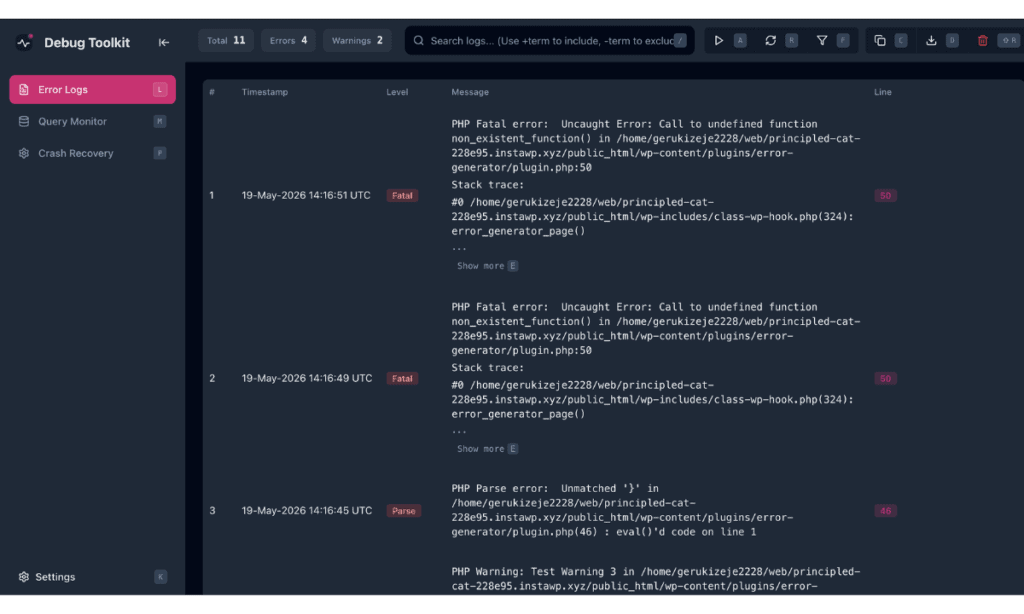
Find the entry showing the error you want to trace. The Level badge confirms the severity of the error: Fatal and Parse appear in red, Warning in yellow, and Notice in blue. The Line column shows the originating line number in a pink, rounded badge.
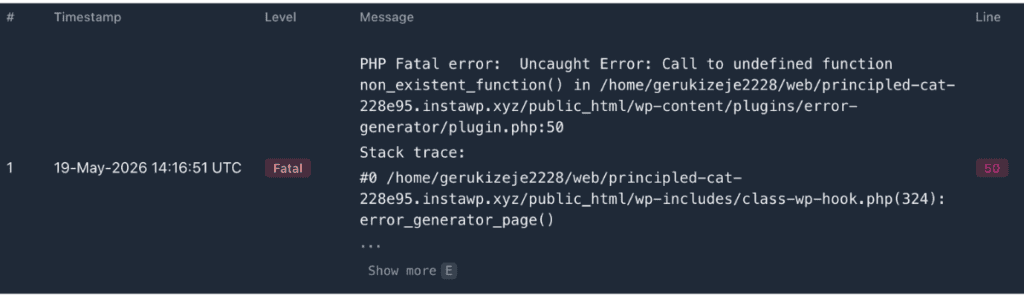
Expanding the stack trace and opening the File Viewer are two independent actions. Clicking Show more expands the call chain inline within the log row. Opening the File Viewer via the eye icon or by pressing the Q shortcut key opens the source file overlay. You do not need to expand the stack trace before opening the File Viewer.
The stack trace for lengthy entries is truncated in the Message column by default. To see the full call chain, click Show more within the entry. Alternatively, press E to expand it via keyboard shortcut.
WPDT reveals the remaining stack trace frames inline, each showing the file path, line number, and function that executed at that point in the chain.
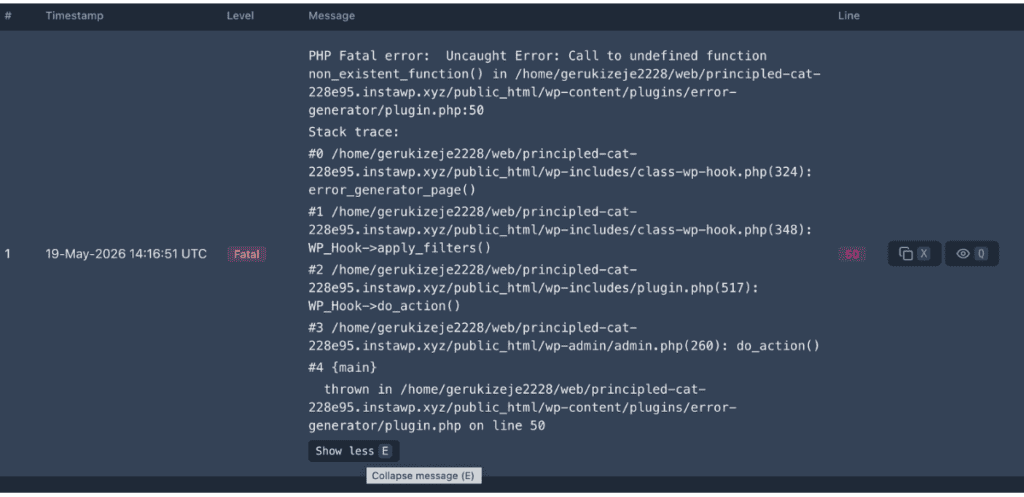
✅ What You Should See The full call chain appears within the row, with each frame in the format #N /path/to/file.php(line): function(). The entry grows to accommodate the additional frames without leaving the log view.
Hover over the entry to reveal its action controls, then click the eye icon to open the Error Details overlay. Alternatively, press Q to open it via keyboard shortcut.
The overlay has two panels. The left panel shows three structured fields:
To jump directly to the error line in the code view, click Jump to Error Line or press J.
The right panel displays the PHP file in a syntax-highlighted code view. The header shows the full file path, the total line count, and the error line in the format N lines | Error on line N. The error line itself is highlighted and centered in the viewport, with surrounding lines visible for context.
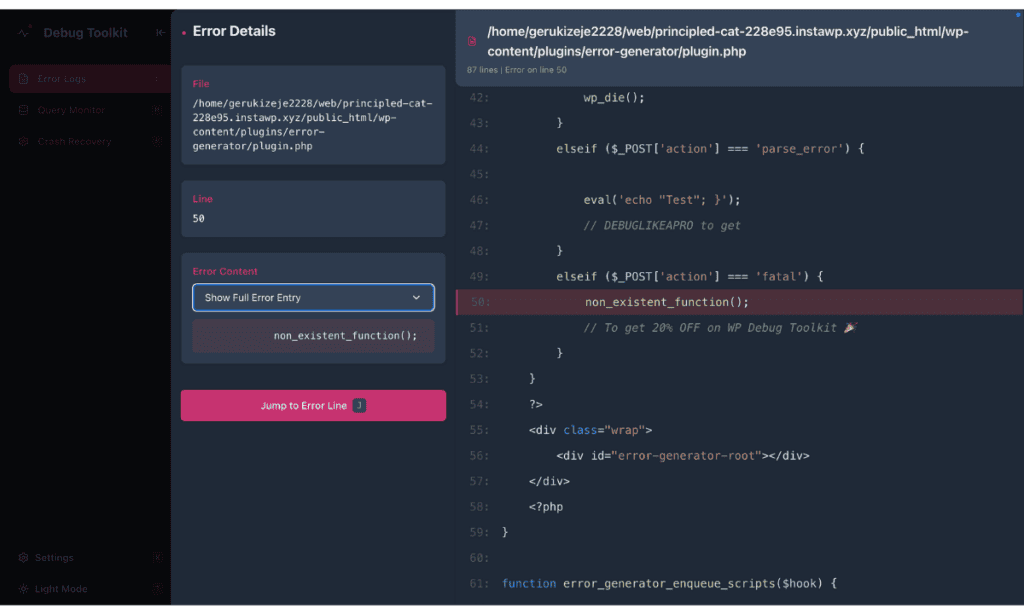
✅ What You Should See: The File Viewer opens as an overlay displaying the PHP source file with syntax highlighting. The error line is highlighted and centered in the viewport, with surrounding lines visible for context. The left panel shows the file path, line number, and extracted error code. Click Jump to Error Line or press J if the view does not center on the error line automatically. If the overlay shows No content available, the file did not load. See the Troubleshooting section below for a quick fix.
The File Viewer cannot display a file in three situations.
Permission issues: The PHP process does not have read access to the file. This can happen with restrictive server configurations or files owned by a different system user. The File and Line fields still accurately identify the error’s origin, so use them to locate and inspect the file manually.
Files outside the web root: Files in system directories or paths not accessible to the PHP process cannot be read. The file path shown in the File field identifies which file WPDT attempted to open.
Files modified since the error: The File Viewer displays the current state of the file, not the state it was in when the error occurred. If the file has been updated, moved, or deleted since the error was logged, the code around the reported line number may no longer match the error.
The Viewer App’s API enforces path traversal protection. Requests for sensitive files are blocked regardless of the path provided. The following files and file types are on the blocklist:
Wp-config.php
Secure-debug.php
.htaccess and .htpasswd
.env
config.php (viewer config)
auth.php (viewer authentication)
rate-limiter.db
Files inside .git directories
SQLite database files (`.sqlite`)
`id_rsa` and `id_dsa` (SSH private keys)
Files inside `.ssh` directories
Attempting to view a blocked file returns an error. This protection cannot be bypassed through path encoding or traversal sequences.
Likely cause: The Viewer App session expired while the overlay was closed, and the code panel cannot load file content without an active session.
Fix: Refresh the page and log back into the Viewer App. Once your session is restored, reopen the Error Details overlay for the entry. The code panel should load the file content.
Likely cause: The Viewer App does not have filesystem read access to the file path shown in the File field.
Fix: Verify the Viewer App has read permissions for the directory containing the file listed in the File field. The File and Line fields still accurately identify the error’s origin. Use them to locate and inspect the file manually if the code panel cannot load the content.
Likely cause: The file has been modified, moved, or replaced since the error was recorded. The File Viewer always displays the current state of the file, not the state it was in when the error occurred. A recent deployment, plugin update, or file edit can shift line numbers or change the code at the reported line entirely.
Fix: Use the timestamp on the log entry to cross-reference with your deployment or edit history. If the file has changed since the error occurred, review the version of the file that was live at that timestamp via version control, a backup, or your host’s file history to see the code that actually ran.
No. The WP Debug Toolkit Viewer App is a standalone application that reads files directly from disk and operates independently of WordPress. It does not require an FTP connection or server credentials beyond its own authentication. As long as the Viewer App has read access to the filesystem at the paths referenced in the stack trace, it surfaces the code context without any external tooling.
Yes. The File Viewer displays files from any plugin or theme that triggers an error. Open the Error Details overlay for any log entry, and the right panel loads the file that originated the error, with the exact line highlighted and surrounding code visible for context. This works across your entire codebase, including WordPress core files, theme files, and plugin files. They all open in the same view.
How to Use the Error Log Viewer in WordPress – How to navigate, read, and act on the entries in your WordPress error log using the Viewer App.
How to Filter & Search WordPress Error Logs – Use +include and -exclude operators to isolate the specific errors you need from a busy log.
Error Capture and the MU-Plugin – How WPDT captures fatal errors before WordPress finishes loading, and why this matters for complete log coverage.
Setting Up the Viewer App – Install the Viewer App as a separate application from the WordPress plugin and configure it to display error logs independently of WordPress.