
You can filter recorded queries in WP Debug Toolkit’s (WPDT) Query Viewer App using three mechanisms that work simultaneously: the search bar with +term to include and -term to exclude keywords or SQL fragments; the All components and All types dropdowns to filter by stack-trace origin and SQL statement type; and the Slow, Errors, and N+1 performance filter buttons to isolate queries by category. Combine any number of these filters, then click Reset to return to the full query set.
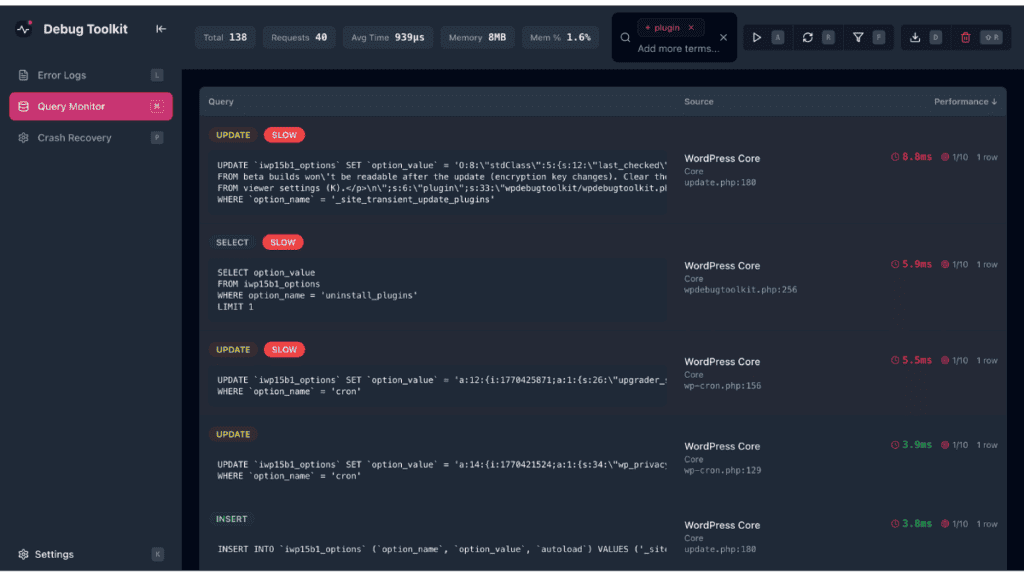
The All components dropdown is a stack-trace origin filter and not a metadata tag. WPDT captures PHP backtrace information for every database query and attributes each query to the first plugin or theme frame found in that trace, falling back to core if none is present, producing the component name and file path visible in the Source column. It is shown as three separate stacked elements: the component name, its type (Core or Plugin), and the originating file path with line number.
The dropdown lists only components that actually generated queries in the current recording, so a plugin that made no database calls during the recorded window will not appear.
When Enhanced Query Logging is active, WPDT uses the db.php drop-in for full backtrace objects and the most accurate component attribution. In basic SAVEQUERIES mode, WPDT falls back to parsing the stack string WordPress provides, which still populates the dropdown but with less precision.
This guide assumes the Viewer App is installed and you are viewing the Query Monitor with at least one recording present. If you have not set up the Viewer App yet, start with Setting Up the Viewer App before continuing. If the Query Monitor shows no data, go to Recording Queries to start a session, capture the page load you want to inspect, then return here.
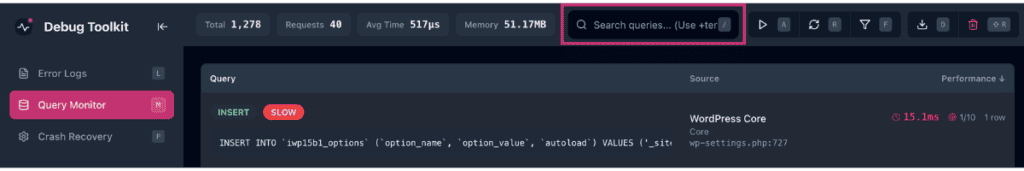
1. Locate the search bar at the top of the Query Monitor view.
2. Type a search term with the + or – operator. Use +wp_posts to show only queries referencing the wp_posts table. Use -wp_options to hide queries referencing wp_options. You can also combine two search terms in a single search; for example, +woocommerce -transient shows only WooCommerce queries that do not involve transients.
Separate multiple terms with commas or press Enter to add them.
3. Review the filtered results. The header stats update immediately to reflect the matching query count.
✅ What You Should See: The query table narrows to entries matching your search terms. The Total count in the header reflects the filtered set, not the full recording.
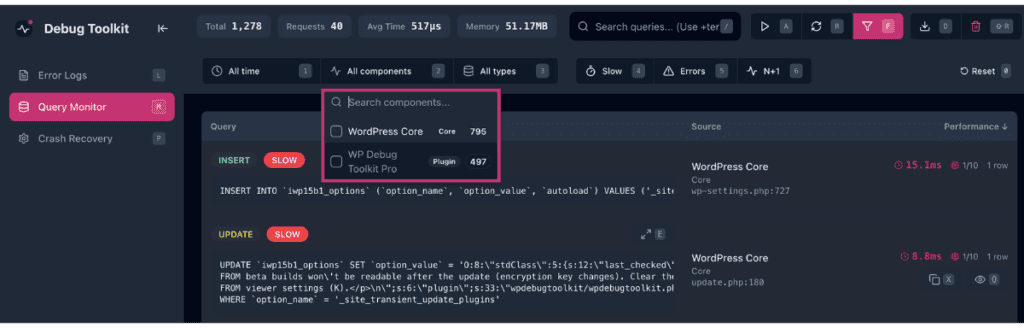
1. Click All components to expand the component dropdown. WPDT lists every component that generated queries in the current recording, each with a query count badge.
2. Select one or more components to isolate their queries. Check WordPress Core to see only core-generated queries. Check a specific plugin component to see only queries from that plugin. Multiple components can also be selected simultaneously. The dropdown label updates to show “X selected” when more than one is active.
3. Read the Source column to confirm the attribution. The Source column confirms the attribution as three separate stacked elements: the component name, its type (Core or Plugin), and the originating file path with line number. For example, WordPress Core, Core, and wp-settings.php:727 as distinct lines.
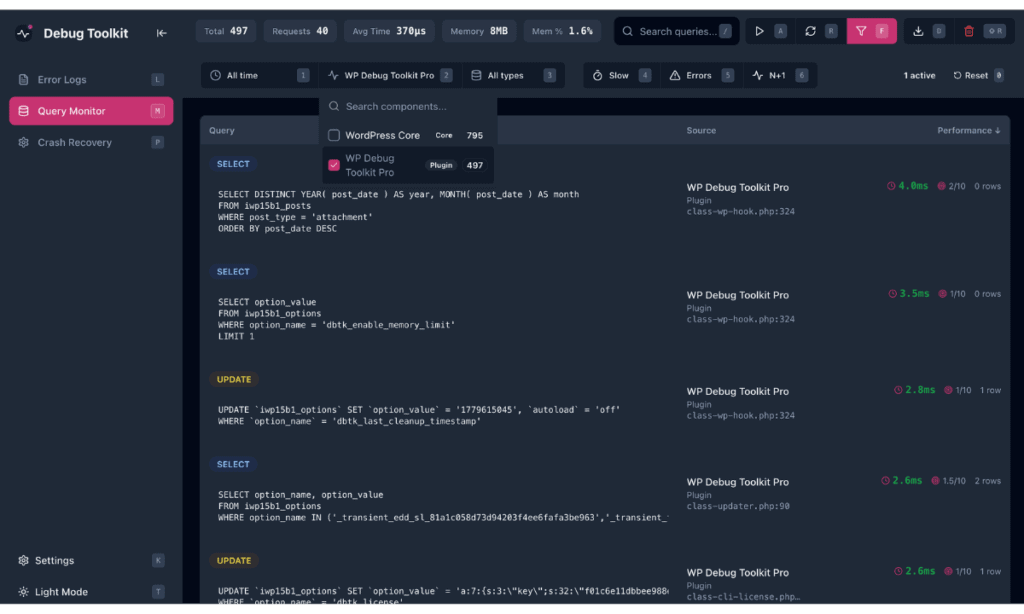
✅ What You Should See: The query table shows only queries attributed to the selected component or components. The header count reflects the filtered set. Deselect components or click Reset to return to the full view.
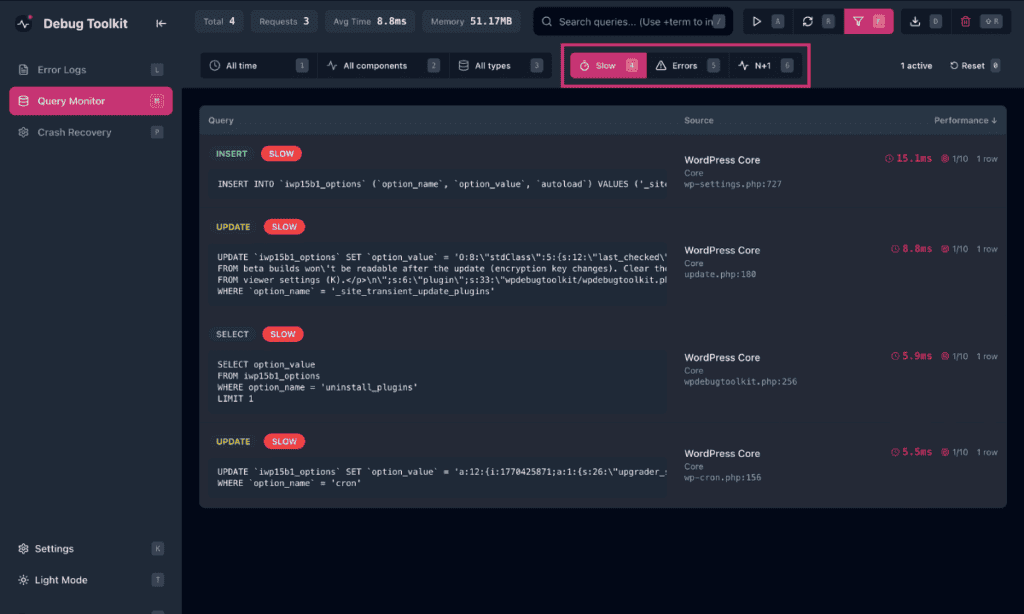
1. Click Slow, Errors, or N+1 to activate that performance filter. Each button shows a keyboard shortcut number: Slow is 4, Errors is 5, N+1 is 6. The buttons toggle, so you can click an active button again to deactivate it.
2. Click All types to filter by SQL statement type. Select one or more statement types: SELECT, INSERT, UPDATE, DELETE, or REPLACE. The dropdown supports multiple selections and shows “X selected” when more than one type is active.

3. Combine filters. All active filters apply simultaneously using AND logic. Activating Slow and selecting WordPress Core in All components shows only slow queries attributed to WordPress Core. You can stack as many filters as needed.
✅ What You Should See: The header counts update to reflect every active filter combined. Click Reset to clear all active filters and return to the full query set.
Likely cause: The All components dropdown populates only from components that generated queries in the current recording. A plugin that made no database calls during the recorded window will not appear.
Fix: Confirm the plugin you want to investigate was active and executing code during the recording session. If it wasn’t, start a new recording and directly trigger its functionality again before stopping the session.
Likely cause: The search term does not match the exact string as it appears in the SQL or in the source file path. Partial matches work, but the term must appear somewhere in the query text or source path.
Fix: Check the Query column for the exact SQL fragment you want to match, then re-enter the search term using that string prefixed with +.
Yes. Both use the same shared search component. Type +term to show only entries containing that string, -term to hide entries containing it, and combine multiple terms by separating them with commas or pressing Enter. The behavior is identical in both tools.
Yes, but with reduced accuracy. In basic SAVEQUERIES mode, WPDT falls back to parsing the stack string WordPress provides and can still identify many components. However, it may attribute some queries to core files rather than the plugin or theme that initiated them. Enabling Enhanced Query Logging (the db.php drop-in) gives WPDT a full backtrace object for every query, making component attribution significantly more precise.
Yes. All active filters in the Query Monitor apply simultaneously using AND logic. Activate Slow and select a component from All components to see only slow queries attributed to that component. Every additional filter you add narrows the result further as they all stack.
Slow Query, N+1, and Duplicate Detection – Learn how WPDT identifies the queries behind the Slow and N+1 filter button counts.
Recording Queries – No queries to filter yet? Start here to capture your first recording.
The db.php Drop-in – How WPDT intercepts every query and captures the backtraces that power component attribution