
WP Debug Toolkit (WPDT) tracks every database query WordPress executes on each page load. Queries write to encrypted files on the filesystem, not to the WordPress database, so monitoring adds no database overhead and does not affect the performance you are measuring.
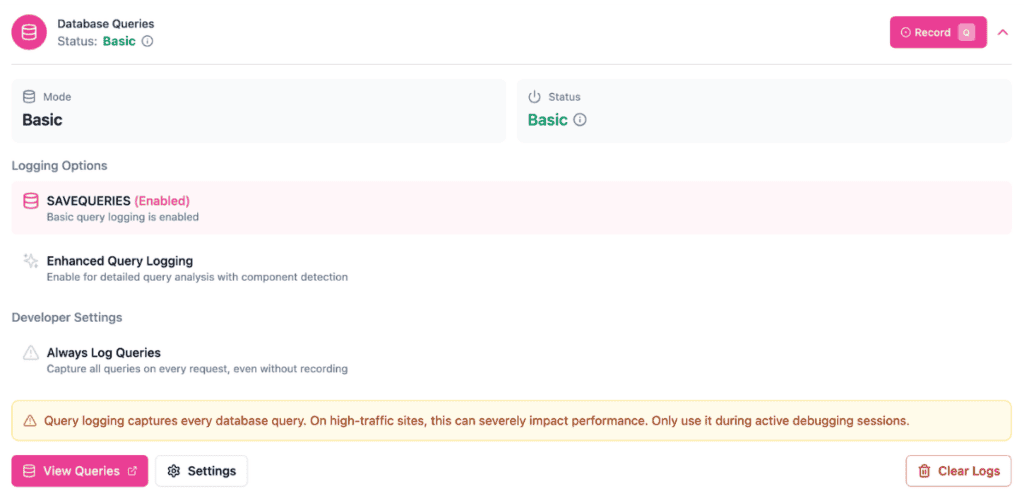
The Database Monitor captures every SQL query that runs through the WordPress wpdb class during a request. For each query, WPDT records:
With enhanced logging enabled via the db.php drop-in, WPDT also captures:
WPDT writes query data to log files at wp-content/uploads/debug-toolkit/queries/, organized by month. March 2026 queries, for example, write to queries-2026-03.log.
This filesystem-based approach gives WPDT a fundamental advantage in accuracy over tools that store query data in the database or in PHP memory.
Most monitoring approaches introduce measurement error. Database-backed tools add their own queries to the result set you are reading. Memory-backed tools inflate peak memory usage and change the allocation profile of the requests you are profiling. WPDT writes to flat files outside the database entirely, so the queries in the log are the queries your site actually ran.
WPDT encrypts all query log entries before writing them to disk. Each line in the log file begins with the DBTKQ1: prefix, followed by the encrypted payload. WPDT uses libsodium when available, falling back to AES-256-GCM via OpenSSL.
WPDT generates the encryption key automatically and stores it in the WordPress database. During Viewer App setup, WPDT syncs that key to the standalone viewer’s config.php.
On virtually all modern PHP installations, plaintext query data, including SQL statements, backtraces, and component names, does not touch the filesystem unencrypted. On servers where neither libsodium nor OpenSSL is available, WPDT falls back to writing plaintext JSON.
This scenario is rare in practice, but worth knowing if you manage older or heavily locked-down server environments.
WPDT supports two logging modes. The difference is whether the db.php drop-in is active.
| Basic | Enhanced | |
|---|---|---|
| How it works | Uses WordPress SAVEQUERIES constant | Installs db.php drop-in that extends wpdb |
| SQL statement | Yes | Yes |
| Execution time | Yes | Yes |
| Backtrace | Basic, parsed from SAVEQUERIES comma-separated stack trace | Yes, full PHP call stack |
| Component attribution | Basic, derived from parsed backtrace | Yes, identifies plugin, theme, or core |
| Caller function | Basic, derived from parsed backtrace | Yes, the function or method that ran the query |
| N+1 detection | Yes | Yes |
Basic logging gives you the SQL statement, execution time, and partial backtrace data parsed from the SAVEQUERIES stack trace.
Enhanced logging, on the other hand, provides full, structured backtraces with precise component attribution and caller identification. For most debugging work, enable enhanced logging.
WordPress supports a database drop-in file at wp-content/db.php. When that file exists, WordPress loads it instead of its default database class. WPDT’s db.php drop-in loads a custom DBTK_DB class that extends wpdb, then instantiates it. DBTK_DB captures a debug_backtrace() call before each query executes and passes the backtrace along with the query results to the logging system.
The drop-in installs automatically when you enable enhanced query logging from the admin dashboard or by running wp dbtk query-log on.
WPDT removes it automatically when you disable enhanced logging. See The db.php Drop-In for details on plugin conflicts and troubleshooting steps.
The Database Monitor offers two approaches to capturing queries.
Recording is the recommended approach for most debugging sessions. Start a time-limited recording from the admin dashboard, reproduce the behavior you want to inspect, then stop the recording.
WPDT captures queries only during the recording window, which runs from 10 seconds to one hour. Recording avoids the disk I/O overhead of continuous logging and gives you a clean, bounded dataset to analyze.
Always-on logging captures every query on every request, regardless of whether a recording is active. This mode generates significant disk writes on active sites.
⚠️Warning: Query logging captures every database query. On high-traffic sites, this can severely impact performance. Only use it during active debugging sessions.
For most sites, recording is the right choice. Start a recording, reproduce the behavior you want to inspect, then review the captured queries in the Query Viewer.
The Query Monitor plugin by John Blackbourn is a well-known tool for inspecting WordPress queries. WPDT takes a different approach.
| WPDT Database Monitor | Query Monitor Plugin | |
|---|---|---|
| Data storage | Filesystem, encrypted log files | PHP memory, displayed in admin bar |
| Database overhead | None | None, also memory-based |
| Persists across requests | Yes, logs accumulate over time | No, data is per-request only |
| Works when site is broken | Yes, standalone viewer operates independently | No, requires WordPress admin bar |
| Admin bar dependency | None | Yes, output is in the admin bar panel |
| Backtrace capture | Yes, with db.php drop-in | Yes |
| Component attribution | Yes | Yes |
| N+1 detection | Yes | No |
| Recording with shareable URLs | Yes | No |
| Export to CSV/JSON | Yes | No |
Query Monitor is built for real-time, per-request inspection from the admin bar. WPDT’s Query Viewer App is built for persistent logging, historical analysis, and debugging even when WordPress itself is unavailable.
Below, you can learn more about each of our documentation available to help you learn more about the Database Monitor feature:
Recording WordPress Database Queries →
Shows you how to start a manual recording session, set a timed recording with the countdown timer, and stop a session when you have the data you need.
Covers when to enable persistent query logging across every page load and when recording is the better choice for production and staging sites.
Shows you how to save a completed recording and generate a shareable URL to hand a query log off to another developer without giving them access to your site.
Slow Query, N+1, and Duplicate Detection →
Explains how to configure the slow-query threshold and how WPDT identifies N+1 patterns and duplicate queries automatically within a recording.
Filtering and Searching Recorded Queries →
Shows you how to narrow down a large query log using the +include and -exclude operators and how to filter by stack-trace origin to isolate queries from a specific plugin or theme.
Query Log Rotation and Retention →
Explains how WPDT manages query log file size over time and how to configure retention settings to match your storage constraints.
Explains what the db.php drop-in is, why WPDT uses one to intercept database queries, and what happens if another plugin removes or overwrites it.
How to Diagnose Slow Database Queries – Something is making your site sluggish. Follow this walkthrough to find exactly what is hitting your database and why.
