
WordPress writes its error log to wp-content/debug.log by default, but the file doesn’t exist until WP_DEBUG_LOG is enabled and an error has occurred. The fastest way to read it is via the WP Debug Toolkit (WPDT) standalone Viewer App: open it and go to Error Logs to see entries with search and filtering built in. Because the Viewer App runs independently of WordPress, it stays accessible even during a white screen or fatal error.
WordPress writes errors to wp-content/debug.log by default, and that file doesn’t exist until WP_DEBUG_LOG is turned on and at least one error has been logged. Setting WP_DEBUG_LOG to a string path instead of true redirects logging to a custom location.
On GridPane, WPDT checks /logs/debug.log one directory above your WordPress root before falling back to the standard location, and other managed hosts route PHP errors to their own log location, accessible through their hosting dashboard.
WP Debug Toolkit detects whichever path your site actually uses (resolved on each request), so you don’t need to track it down manually. See Custom Log Paths for how WPDT resolves the path and how to override it.
If debug.log doesn’t exist anywhere on your site, logging isn’t enabled yet. Toggle WP_DEBUG and WP_DEBUG_LOG on directly from the WP Debug Toolkit Overview page, inside the Error Logging card, rather than editing wp-config.php by hand. For the full toggle walkthrough, see How to Enable WordPress Debug Mode.
Visit your Viewer App at its installed URL, typically https://yoursite.com/wpdebugtoolkit/ or a custom slug if you’ve configured one. The Error Logs viewer opens by default.
This step is the reason the standalone Viewer App exists separately from wp-admin. If your site is showing a fatal error or a white screen and wp-admin won’t load, the Viewer App still will, because it doesn’t bootstrap WordPress to run.
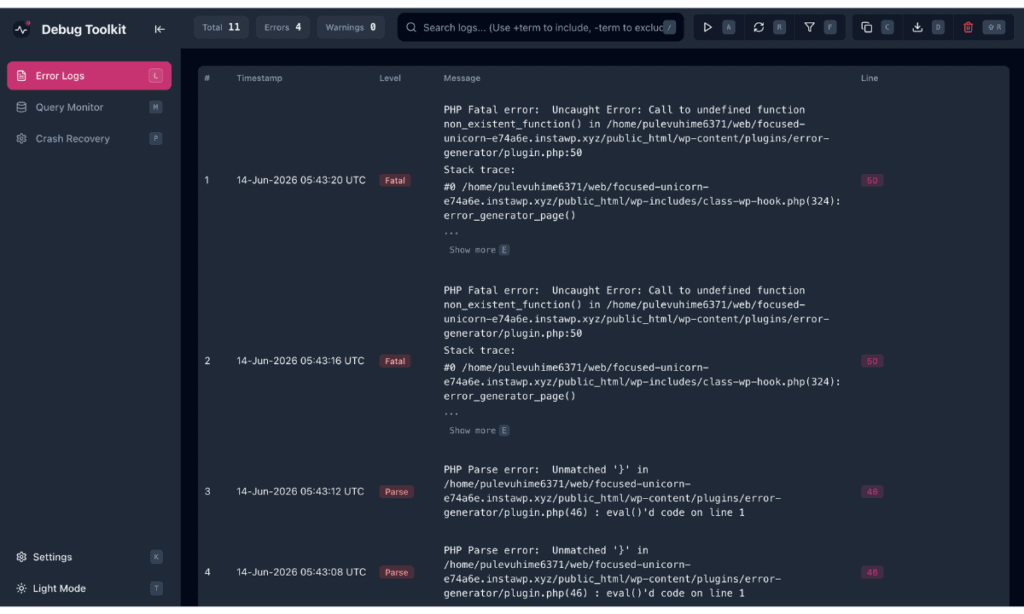
| ✅ What You Should See: The Error Logs view lists entries in reverse chronological order, each with a timestamp, a level badge (Fatal, Parse, Warning, Error, or Notice), and the error message. A summary bar at the top shows the total entry count and error count. |
Use the search box at the top of the Error Logs viewer to narrow the list. Prefix a term with + to require it, or – to exclude it. For example, searching +checkout -deprecated shows only entries mentioning “checkout” while hiding anything tagged “deprecated.” For the complete syntax and additional filter options, see How to Filter and Search WordPress Error Logs.
To inspect the code around where an error occurred, hover over an entry and press Q to open its File Viewer. To export the entries currently visible after any search or filters are applied, press D.
A fatal error entry looks like this:
[01-Mar-2026 14:32:10 UTC] PHP Fatal error: Allowed memory size of 268435456 bytes exhausted

(tried to allocate 65536 bytes) in /wp-content/plugins/example-plugin/includes/class-import.php on line 215
This format identifies the error type, the responsible file, and the line number, which is usually enough to start your investigation before opening the file itself.
Likely cause: WP_DEBUG or WP_DEBUG_LOG isn’t enabled, or wp-content/ isn’t writable by PHP.
Fix: Enable both constants from the WP Debug Toolkit Overview page, Error Logging section. See How to Enable WordPress Debug Mode for the full walkthrough. If both are already enabled and the file still doesn’t appear, check that wp-content/ has write permissions for the PHP process.
Likely cause: The Viewer App is pointing at a log path that no longer matches your site, often after a host migration changes the log location.
Fix: Check the configured path in Custom Log Paths and update it if it’s stale. If the Viewer App itself appears broken rather than just misconfigured, follow the instructions in Repairing a Broken Viewer Install.
Likely cause: The PHP process doesn’t have read access to the log file, usually after a permissions change or a server migration.
Fix: Check the file’s ownership and permissions on the log file. It needs to be readable by the same user PHP runs as on your server.
Likely cause: A plugin or theme is generating the same error repeatedly, often thousands of times per hour.
Fix: Open the log in the Viewer App rather than downloading it over FTP. The Viewer App loads entries and lets you apply filters, so you can identify the noisy source without pulling the entire file. For long-term size management, see Error Log Rotation and Retention.
Press Shift + R inside the Viewer App to clear the log, or click Clear Log from the Error Logging section on the WPDT Overview page. WordPress creates a fresh debug.log the next time an error occurs. Clearing it after resolving an issue is good practice, as it makes new errors easier to spot rather than hunting through thousands of historical entries. For automatic size management, see Error Log Rotation and Retention.
A 500, 502, 503, or timeout error often doesn’t appear in debug.log at all. debug.log captures PHP errors routed through WordPress, not server-level failures. Check your web server’s own error log (Apache or Nginx) through your hosting control panel. That log typically captures crashes and timeouts that never reach WordPress’s error handling.
Visit your Viewer App’s URL directly. It doesn’t require WordPress to load, so it remains accessible during a fatal error or white screen. If the Viewer App isn’t installed and wp-admin is also inaccessible, direct file access via FTP or SSH is your remaining option. For the recovery email path, see WordPress Recovery Mode Integration, and for resolving the underlying issue once you’ve identified it, see Crash Recovery.
How to Use the WordPress Error Log Viewer – Learn every element of the Error Logs interface and what each one tells you about what went wrong.
How to Filter and Search WordPress Error Logs – Master the full search and filter syntax so you can zero in on the entries that matter in any size log.
Custom Log Paths – Find out how WPDT detects your log location and override it when your log isn’t at the default path.
