
To debug a suspected plugin issue, open the WP Debug Toolkit (WPDT) Viewer App; the Error Logs viewer is opened by default. Set the All sources filter to Plugins to check for plugin-originated PHP errors, then narrow further using the All plugins filter if you need to isolate a specific plugin. Next, select Database Queries and review the Source column for plugin-attributed database queries. If either points to a specific plugin, use Crash Recovery‘s Plugins tab to isolate it at the filesystem level without needing to directly access wp-admin.
A plugin update just shipped a fatal error on the checkout page of your WordPress site. Or a page that loaded in under a second last week now takes forever, and the slowdown started right after you activated a new plugin. Or a feature behaves in a way you didn’t expect, and you’ve narrowed it down, at least mentally, to one plugin’s code, but you need confirmation before you update, replace, or remove it.
WP Debug Toolkit gives you three tools for exactly this situation. The Error Log Viewer shows you whether the plugin is throwing PHP errors; the Database Queries view’s component attribution shows you whether it’s generating excessive or slow database queries; and the Crash Recovery feature lets you isolate the plugin at the filesystem level if either tool points to it.
This guide walks you from a suspected plugin issue to confirmation and, if needed, isolation.
| WPDT Tool | Role in This Guide |
|---|---|
| Error Log Viewer | Filters the error log by source to show only entries originating from plugin files, confirming whether the plugin is throwing PHP errors. |
| Database Queries | Component attribution identifies whether a specific plugin is generating excessive or slow database queries. |
| Crash Recovery | Isolates the suspect plugin at the filesystem level if the error log or query log points to it, without requiring wp-admin access. |
This guide assumes that you have the following in place before you jump into diagnosing:
WP_DEBUG and WP_DEBUG_LOG both on)SAVEQUERIES) enabled before the slow page load occurs. Queries cannot be captured retroactively.Open the Viewer App, and the Error Logs viewer will open by default. Set the All sources filter to Plugins. This filters the log to entries whose stack traces originate in wp-content/plugins/, the directory where every standard plugin installs.
Keep in mind that errors originating in wp-content/mu-plugins/ fall under the Custom Code filter, not Plugins. If you suspect a must-use plugin rather than a standard plugin, check Custom Code as well.
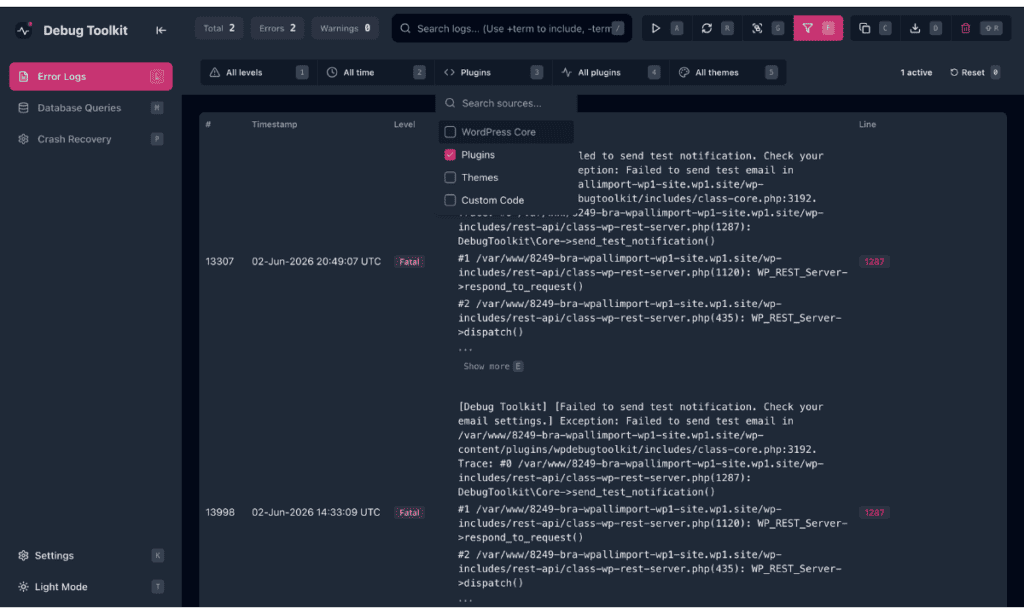
What You Should See: The filtered results show only plugin-attributed entries. Each file path follows the pattern wp-content/plugins/<plugin-slug>/..., which identifies the responsible plugin by its directory name.
🔀 Decision Point: If you see fatal errors or warnings here with a file path under a specific plugin’s directory, note the plugin slug, file, and line number, then proceed to Phase 3 to isolate that plugin. If the All sources › Plugins filter shows nothing, the problem may not be a PHP error. Continue to Phase 2 to check for a performance issue.
Navigate to WP Debug Toolkit › Overview and open the Database Queries card. Click Record to start a recording, or enable Always Log Queries to capture every database query until you manually turn it off.
Reproduce the slow page load, then read the captured query data. In the Viewer App, select Database Queries from the left sidebar. The Source column identifies the component responsible for each query. Press F to reveal the filters and then use the All components filter to drill into a specific plugin’s queries.
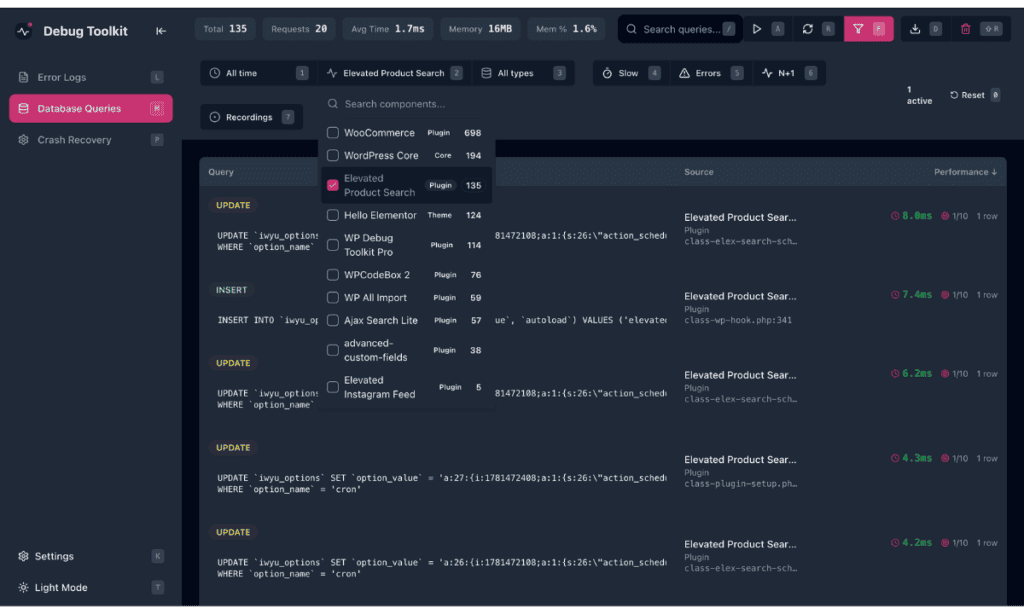
✅ What You Should See: Each query row shows a source label, such as WordPress Core, a plugin slug, the active theme, or a must-use plugin. A plugin that is causing a problem typically accounts for a disproportionate share of query rows.
🔀 Decision Point: If one plugin accounts for a disproportionate share of queries, especially with N+1 or duplicate patterns after filtering, it points to that plugin as the source. Proceed to Phase 3 if you need the site to function while you investigate or wait for a fix. If queries are evenly distributed across plugins and core, a single plugin likely isn’t the source. How to Debug WordPress will route you to the right tool.
Select Crash Recovery from the Viewer App’s left navigation and click the Plugins tab. Locate the plugin identified in Phase 1 or Phase 2 by its directory slug, then click to isolate it.
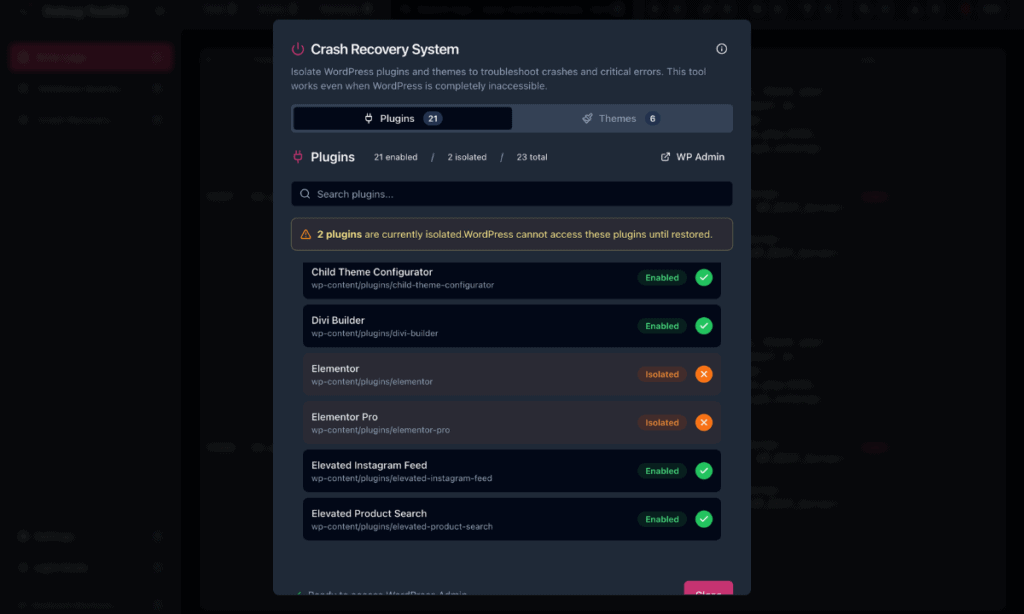
✅ What You Should See: The plugin’s status badge changes to Isolated, and the alert banner at the top of the Plugins list confirms WordPress cannot access the plugin until it is restored.
This is the routine case, not an edge case. Unlike isolating an active theme, isolating a plugin doesn’t leave WordPress without a fallback. WordPress runs normally without any given plugin by design, so Crash Recovery’s Plugins tab is the baseline tool for this kind of investigation.
🔀 Decision Point: If the error from Phase 1’s Custom Code filter, or the component attribution from Phase 2, points to a component in wp-content/mu-plugins/ rather than wp-content/plugins/, Crash Recovery’s Plugins tab cannot isolate it. Must-use plugins load unconditionally regardless of directory renames, so they do not appear in this tab at all.
After you have resolved the issue, whether by updating, replacing, or removing the responsible plugin, restore it from the Plugins tab in Crash Recovery, which renames the directory back. Note that WordPress does not re-activate the plugin automatically. Re-activate it from wp-admin › Plugins if it was active before, then confirm no new errors appear in Error Logs.
Restoring is the exact reverse of isolating, using the same Crash Recovery › Plugins tab. Find the isolated plugin and click to restore it, which renames the directory back. Note that WordPress does not re-activate the plugin automatically. Re-activate it from wp-admin › Plugins if it was active before. No data is lost in this process. Crash Recovery only renames the plugin’s directory; it doesn’t delete or modify any files.
No. Crash Recovery’s Plugins tab manages standard plugins in wp-content/plugins/ only. Must-use plugins in wp-content/mu-plugins/ load unconditionally and don’t appear in that tab, so Crash Recovery has no mechanism to isolate them.
How to Use the WordPress Error Log Viewer – Full reference for the Error Logs view, including all source and level filters used in Phase 1.
Crash Recovery – Complete walkthrough of the isolate-and-restore workflow used in Phase 3, including the Themes tab and the three confirmed limitations.
How to Debug WordPress – If filtering the error log to Plugins doesn’t point to the problem, this guide routes you to the right tool for other problem types.
