
Open the WP Debug Toolkit (WPDT) Viewer App and check the Error Logs tab first. Most WordPress problems leave a trace there with a file path and line number. If the log shows a fatal error, use the Crash Recovery feature to isolate the responsible plugin or theme. If the page loads but feels slow with nothing in the log, start a Query Logger recording at WP Debug Toolkit › Overview › Database Queries in wp-admin. The Viewer App remains accessible even when WordPress is completely down, so for error and crash scenarios, it is your starting point regardless of whether wp-admin is reachable.
Something is wrong with your WordPress site, but you don’t yet know what or where. Maybe you’re looking at an error message, a blank white page, a slow-loading page, a broken layout, or a site that won’t load in the browser or wp-admin at all.
This guide uses two entry points from WP Debug Toolkit: the Viewer App and wp-admin. The Viewer App houses the Error Logs tab and Crash Recovery feature, and remains accessible even when WordPress is completely down. The Query Logger recording starts from wp-admin and applies when the site is loading but performing poorly.
Each addresses a different category of problem, and the goal here is not to fix anything directly. It’s to figure out which category you’re in. This guide walks you from “something is wrong” to the specific tool and guide that addresses it.
| WPDT Tool | Role in This Guide |
|---|---|
| Viewer App: Error Logs | First stop for any problem. Most errors leave an entry here with a file path and line number, and the Viewer App remains accessible even when WordPress is completely down. |
| Viewer App: Crash Recovery | Isolates a plugin or theme identified as the source of a fatal error, without requiring wp-admin access. |
| WP Debug Toolkit › Overview › Database Queries (wp-admin) | Where you start a time-limited Record Queries session to capture database queries during a slow page load. |
| Viewer App: Database Queries | Where you review and analyze recorded query log entries. Continuous query logging can also be toggled on or off from this view. |
This guide assumes the following are in place before you start diagnosing.
WP_DEBUG and WP_DEBUG_LOG toggled to ON, so errors are actually being written to the log. If you haven’t done this yet, see How to Enable WordPress Debug Mode before continuing.Before you investigate anything else, open the Viewer App to investigate log entries in the Error Logs viewer. Most problems with your WordPress site, including fatal errors, warnings, and deprecated notices, leave a trace here, and that trace usually points directly at the responsible file.
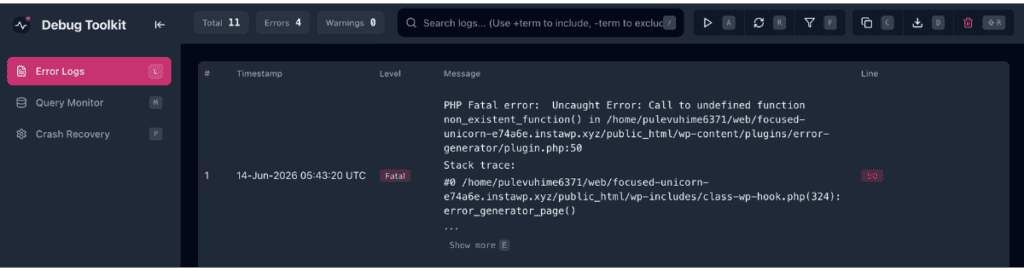
✅ What You Should See: If the log contains a recent entry, it names a specific file, often inside a plugin or theme folder, along with a line number and a severity badge such as Fatal, Error, Warning, Notice, or Parse. If the log is empty or shows nothing from the relevant time window, move to Phase 2 with that information in hand.
What the log shows (or doesn’t show) determines your next move. Match what you found in Phase 1 to one of the branches below.
🔀 Decision Point
debug.log file or manually disable plugins. This is precisely why installing the Viewer App before a crisis occurs is strongly recommended.Once you’ve identified the responsible component, whether through Crash Recovery’s isolation results, Query Logger findings, or conflict testing, the resolution pattern is the same regardless of which branch you took.
If the original problem was a fatal error, and you have the Email Notifier module licensed with the MU plugin installed, WPDT will have sent a notification email alongside WordPress’s native recovery email. See WordPress Recovery Mode Integration for what happens next on the WordPress side.
✅What You Should See: The page or action that previously failed now completes without errors, and the Error Logs tab in the Viewer App shows no new entries from your test.
Check the WordPress error logs in the WPDT Viewer App. Most issues, including fatal errors, warnings, and notices, leave a trace with a file path and line number, and that single entry usually narrows your investigation to one plugin or theme before you do anything else.
Not all WordPress problems generate PHP errors. Visual bugs, caching issues, and some plugin conflicts may not log anything. In that case, test for a theme or plugin conflict by deactivating suspects one at a time, and check the Database Monitor if the issue looks like a performance problem rather than a visual one.
A white screen almost always means a fatal PHP error terminated the page before it could render. Check the error log first; the entry will name the responsible plugin or theme file. From there, use Crash Recovery in the WPDT Viewer App to isolate that plugin or theme without needing wp-admin access. The Viewer App is accessible even when WordPress is completely down, which is what makes it the right tool for this specific scenario.
Enabling WP_DEBUG on a live site is risky if WP_DEBUG_DISPLAY is also on, because that pushes raw error output to the front end, exposing file paths and code internals to visitors. The safe pattern is WP_DEBUG on, WP_DEBUG_LOG on, and WP_DEBUG_DISPLAY off. With this setting, errors are written to the log silently without appearing on screen. WPDT manages all three constants from wp-admin with a single toggle, so there’s no need to manually edit wp-config.php.
If wp-admin won’t load, your entry point is the WPDT Viewer App, which operates independently of WordPress and remains accessible during a fatal error or white screen. From there, you can read your WordPress error logs and use Crash Recovery to isolate the responsible component. If the Viewer App isn’t installed yet, you’ll need server-level access via FTP, SSH, or your hosting control panel to read the raw debug.log file, which is exactly why installing the Viewer App before a crisis occurs matters.
How to Debug WordPress with WP Debug Toolkit – Gets you installed, oriented, and looking at your first log entries. Start here if you haven’t set WPDT up yet.
Crash Recovery – Shows you exactly how to isolate and disable a plugin or theme without touching wp-admin, once the error log names it as the culprit.
How to Check WordPress Error Logs – Explains where your log file lives and what each entry means. If Phase 1 left you with questions, read this.
How to Diagnose Slow Database Queries – Takes over where Phase 2 leaves off, walking you through how to start a Query Logger recording and interpret the results.
