
To debug a WordPress theme issue, open the Viewer App; the Error Logs tab opens by default. Use the All sources filter and select Themes to filter the log to all theme-originated errors. Next, narrow further using the All themes filter if you need to isolate a specific theme. Next, check the Query Logger‘s component attribution to see if the theme is generating excessive or slow database queries. If either points to the theme, use Crash Recovery‘s Themes tab to isolate it.
A theme issue can show up in different ways. It could be a layout that breaks after a theme update, a PHP warning that appears on every page since you switched themes, or a page that loads noticeably slower than before. In each case, you suspect your active theme, but you have not confirmed it yet.
WP Debug Toolkit gives you three tools for this: the Error Log Viewer to catch PHP errors originating in theme files, Database Queries to see whether the theme’s templates are generating an unusual number of database queries, and Crash Recovery to isolate the theme at the filesystem level if you need the site to function while you fix it. This guide walks you from a suspected theme issue to confirmation and, if needed, isolation.
| WPDT Tool | Role in This Guide |
|---|---|
| Error Log Viewer | Filters the error log by source to show only entries originating from theme files, confirming whether the theme is throwing PHP errors. |
| Database Queries | Component attribution identifies whether the active theme’s templates are generating excessive or slow database queries. |
| Crash Recovery | Isolates the suspect theme at the filesystem level if the error log or query log points to it, without requiring wp-admin access. |
This guide assumes the following are in place before you start diagnosing.
WP_DEBUG and WP_DEBUG_LOG both ON).wp-content/themes/. This is the theme WordPress falls back to once your active theme becomes unavailable.Open the WPDT Viewer App; the Error Logs tab opens by default. Open the All sources filter and select Themes.
This filters the log to entries whose file paths include wp-content/themes/. That includes your active theme, any parent theme it depends on, and any inactive themes that may have logged errors recently, for example, if you switched themes a short time ago.
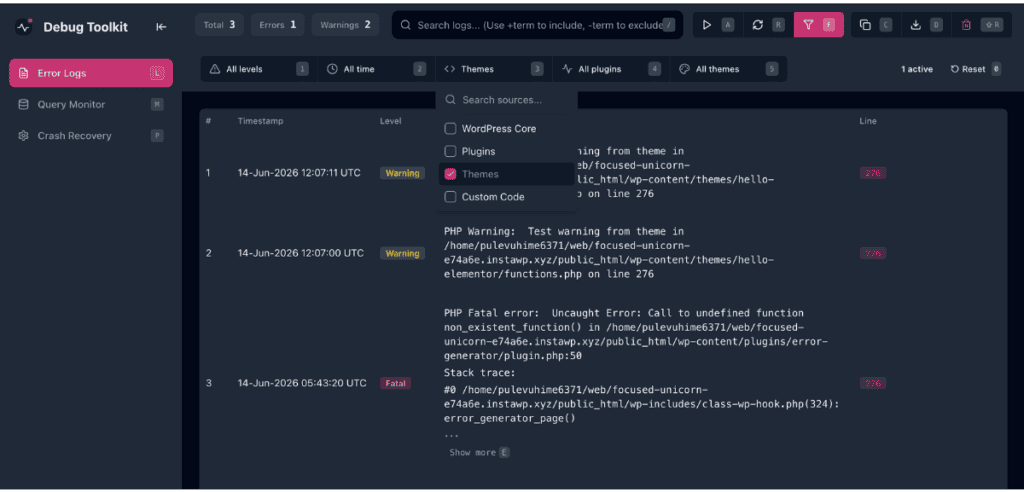
✅ What You Should See: The filtered results show only entries attributed to theme files, with file paths under wp-content/themes/ instead of wp-content/plugins/ or core WordPress paths.
🔀 Decision Point: If you see fatal errors or warnings here with a file path under your active theme, note the file and line number, then proceed to Phase 3 to isolate. If this filter shows nothing, the problem may not be a PHP error. Continue to Phase 2 to check for a performance issue.
In wp-admin, navigate to WP Debug Toolkit › Overview. Find the Database Queries section and click Record, then reproduce the slow page load. Once you are done, click View Queries to open the results in the Viewer App. You can also open the Viewer App directly and select Database Queries from the sidebar.
Each recorded query is attributed to the plugin, theme, or core component that generated it using backtrace analysis. Use the Component field on each query entry to identify which queries are attributed to your active theme’s template files. Also check the Statistics view for an overall picture of how queries are distributed.
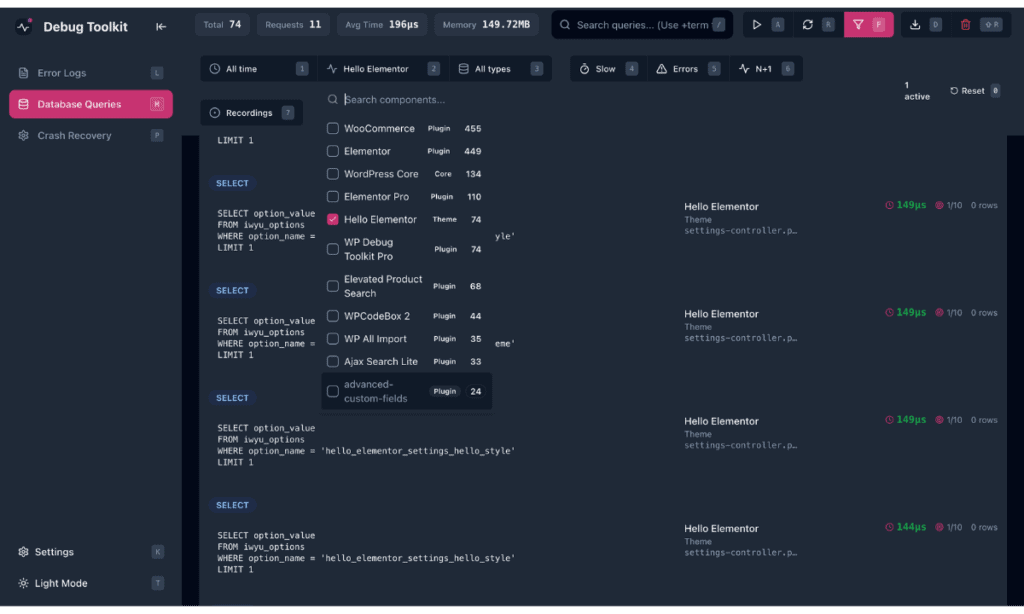
✅ What You Should See: The Component field and Statistics view show a disproportionate share of queries attributed to your active theme’s template files, often clustered around a single template, sometimes with repeated identical queries. Two to four repeats are tracked as duplicates; five or more are flagged as an N+1 pattern.
🔀 Decision Point: If the theme accounts for a disproportionate share of queries, especially with duplicate or N+1 patterns, this points to a template-level issue. Fix the responsible template code, or proceed to Phase 3 if you need the site to function while you investigate. If queries are evenly distributed or theme attribution is minimal, the theme likely is not the source. Return to How to Debug WordPress for broader triage.
In the Viewer App, select Crash Recovery from the sidebar, then select the Themes tab. Crash Recovery uses the same isolate-and-restore mechanism here as it does for plugins. Isolating a theme renames its directory in wp-content/themes/, and toggling it back on renames the directory back to its original name. Crash Recovery does not modify WordPress’s stored active-theme reference directly. WordPress reconciles that state the next time wp-admin loads.
The Themes tab lists every theme directory individually, so a parent theme and its child theme appear as separate, independently isolatable entries.
How you proceed depends on whether the theme you suspect is currently active.
If the suspect theme is inactive (for example, an old theme you switched away from), isolating it carries low risk. The site is not using its files, so renaming the directory has no immediate effect on the front end.
If the suspect theme is your active theme or its parent, treat this as a more deliberate step. Isolating renames the directory WordPress is configured to render with, so the front end is likely to show a fatal error immediately. This happens since WordPress can no longer load the theme’s style.css, index.php, and functions.php at their registered paths.
WordPress’s own theme validation runs on the next wp-admin load and automatically switches the site to a default theme if the active theme is missing. This is why the Before You Begin checklist asks you to confirm a default theme is present before you isolate. It is the theme WordPress switches to during the reconciliation process.
After isolating, load wp-admin to trigger the switch, confirm the front end renders again (now with the default theme’s styling), and use the Themes tab to restore your original theme once you have applied your fix.
If your active theme is a child theme and you isolate its parent instead, expect the same kind of disruption: most child themes depend on the parent for core template files, so removing the parent’s directory affects rendering even though the child theme’s own directory is untouched.
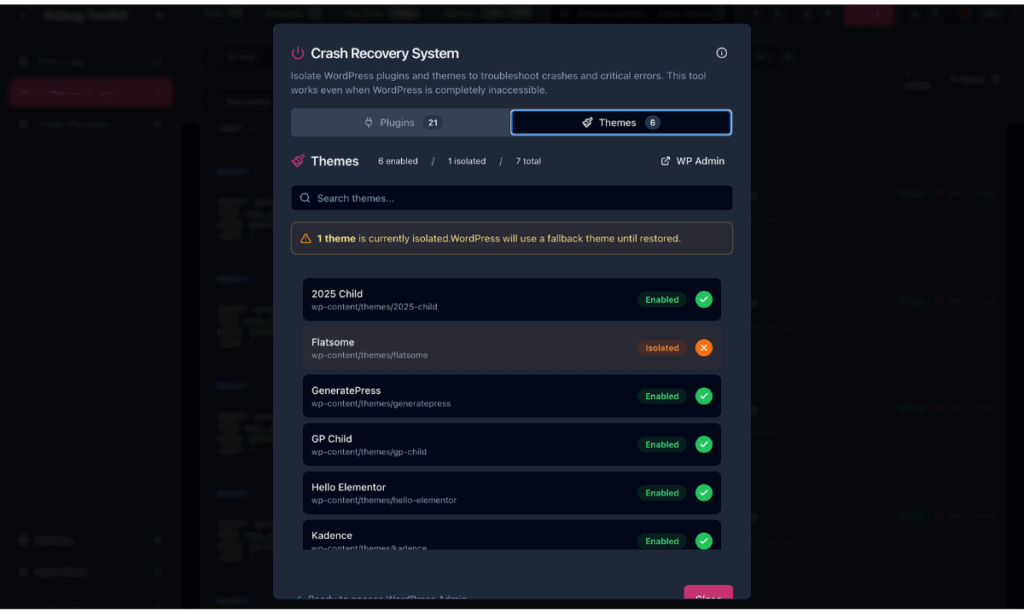
✅ What You Should See: The isolated theme’s row in the Crash Recovery panel shows a status badge of Isolated. Toggle the theme back on using the per-row toggle; the badge returns to Enabled and the directory is renamed back.
The fastest way to confirm it is to open the WPDT Viewer App, select All sources, and check the Themes option. If entries appear with file paths under wp-content/themes/, the theme is generating PHP errors. If nothing appears, the problem may not be a PHP error at all; check that WP_DEBUG and WP_DEBUG_LOG are both toggled ON in WPDT’s Debug Constants settings. Otherwise, errors are never written to the log in the first place.
Open the WPDT Viewer App and filter the error log by the Themes source. Look for fatal errors or warnings timestamped around the time of the update. The entry will include the exact file path and line number where the theme broke. That tells you precisely what the update changed and what needs fixing, without any guesswork about which template or function is responsible.
Yes, and the cause is almost always the database. Theme templates that run a query per post inside a loop, or custom queries that are not cached, add up quickly on content-heavy pages. Start a query recording from the Database Queries section when you navigate to WP Debug Toolkit › Overview in wp admin. Reproduce the slow page load, then open the results in the Viewer App and review the Component attribution and Statistics view. If your active theme’s template files account for a disproportionate share of queries, you have found the source.
In Debug Toolkit, use the Debug Constants settings to set WP_DEBUG and WP_DEBUG_LOG to ON and WP_DEBUG_DISPLAY to OFF. Errors write to your log file without surfacing to visitors, so you can reproduce and read theme errors safely on a live site. For performance issues, use query recording instead. It has no visitor-facing impact and can be stopped as soon as you have the data you need.
How to Use the WordPress Error Log Viewer – Get the full picture on source filters, level filters, and everything else the Error Logs view can show you beyond what Phase 1 covers.
Crash Recovery – Go deeper on the isolate-and-restore workflow, including the Plugins tab and the three limitations that apply to both tabs.
How to Debug WordPress – If the Themes filter comes up empty, start here to find the right tool for whatever else might be causing the problem.
