
WP_DEBUG turns on WordPress error reporting; WP_DEBUG_LOG writes those errors to a file; and WP_DEBUG_DISPLAY controls whether they are printed to the browser. For almost every site, you want the first two on and the third off. WP Debug Toolkit (WPDT) lets users toggle all three from WP Debug Toolkit › Overview › Error Logging, eliminating the need for FTP access or manual editing of wp-config.php.
WordPress controls debug mode with three constants defined in wp-config.php. WP_DEBUG is the master switch: when set to true, PHP errors, warnings, and notices are reported instead of being silently ignored.
WP_DEBUG_LOG tells WordPress to write those reported errors to wp-content/debug.log (or a custom path), but only does anything if WP_DEBUG is also true.
WP_DEBUG_DISPLAY controls whether the errors print directly on the page, and WordPress defaults it to true if you don’t define it yourself. That default only becomes visible once WP_DEBUG is on, since that’s when WordPress acts on WP_DEBUG_DISPLAY at all. In practice, enabling WP_DEBUG without explicitly setting WP_DEBUG_DISPLAY to false means errors will show up in the browser.
The Settings Reference table below covers how these three interact.
Navigate to WP Debug Toolkit › Overview. In the Error Logging panel’s Debug Constants list, click the WP_DEBUG row to enable it, then click the WP_DEBUG_LOG row to enable it.
Each click writes one constant to wp-config.php immediately using an atomic process: WPDT writes the change to a temp file, syntax-checks it, then swaps it in. If the write or syntax check fails, the temp file is discarded, and your existing wp-config.php is left untouched.
For a full walkthrough of this toggle interface, including screenshots of each step, see How to Automatically Enable WordPress Debug Mode.
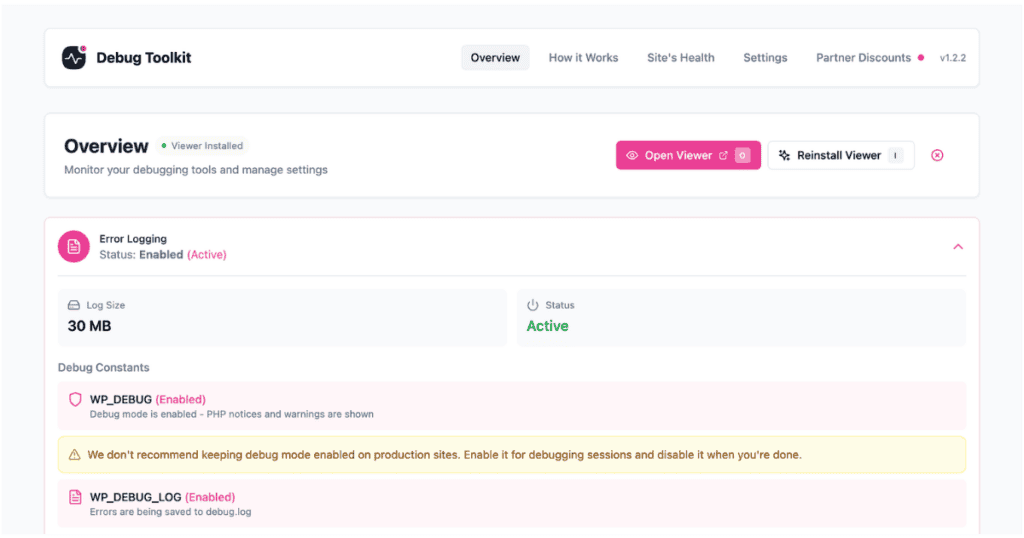
What You Should See: After enabling WP_DEBUG, the Error Logging panel’s status changes to Enabled (Active). Both WP_DEBUG and WP_DEBUG_LOG show an (Enabled) label in the Debug Constants list once toggled on.
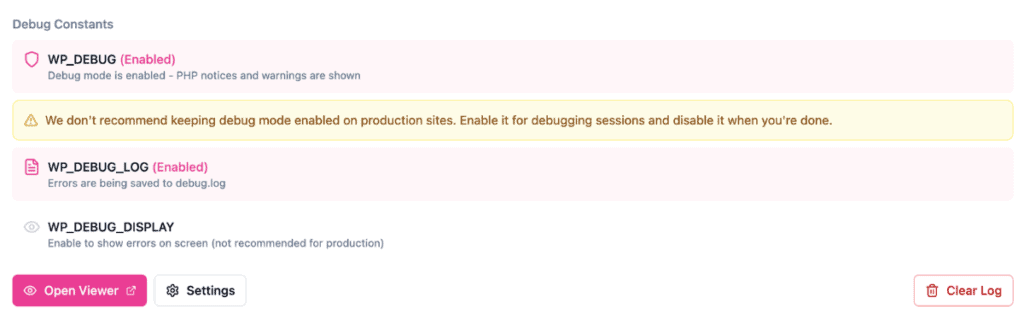
The WP_DEBUG_DISPLAY constant appears as its own row in the Debug Constants list, labeled WP_DEBUG_DISPLAY with the description “Enable to show errors on screen (not recommended for production).”
On any site your visitors or clients can reach, leave this OFF. Errors logged to file give you everything you need to diagnose an issue without exposing file paths, function names, or database details to the public.
Turn it ON only on a local or staging environment where you are actively debugging and nobody else will see the output.
Confirm wp-content/debug.log exists and is growing as new errors occur, or check the Error Logs view in the standalone Viewer App for incoming entries. The Viewer App reads logs independently of WordPress, so it remains available for this check even if wp-admin becomes unreachable.
✅ What You Should See: New entries begin appearing in the Error Logs view as errors occur on your site.
If you prefer the command line, wp dbtk debug gives you the same control:
bash

# Enable WP_DEBUG and WP_DEBUG_LOG (sets WP_DEBUG_DISPLAY to true too with --display)

wp dbtk debug on --display

# Enable WP_DEBUG and WP_DEBUG_LOG only, leaving WP_DEBUG_DISPLAY false

wp dbtk debug on

# Disable all three constants

wp dbtk debug off

# Check current status, including SAVEQUERIES and the resolved log path

wp dbtk debug status --format=table
You can still edit wp-config.php by hand on any WordPress site, but manual edits risk typos and duplicate constant definitions. WPDT’s atomic-write process avoids both. See How to Safely Modify wp-config.php for how that mechanism works.
| Combination | Result |
|---|---|
WP_DEBUG false (WP_DEBUG_LOG and WP_DEBUG_DISPLAY have no effect) | Debug mode off. Most errors suppressed. |
WP_DEBUG true, WP_DEBUG_LOG true, WP_DEBUG_DISPLAY false | Errors logged to file, hidden from visitors. The production setting. |
WP_DEBUG true, WP_DEBUG_LOG true, WP_DEBUG_DISPLAY true | Errors logged to file and shown in the browser. The development setting. |
WP_DEBUG true, WP_DEBUG_LOG false, WP_DEBUG_DISPLAY true | Errors shown in the browser but not logged. Not recommended. |
Likely cause: Your hosting environment restricts file permissions on wp-config.php. This is common on managed hosts such as Flywheel and GridPane.
Fix: WPDT attempts automatic permission elevation first, then falls back to manual editing if elevation fails. See Permission Elevation for what each outcome looks like. If you’re on GridPane, Environment and Hosting Detection explains how WPDT handles that host’s secure-debug.php setup specifically.
Likely cause: A duplicate WP_DEBUG_DISPLAY definition exists elsewhere in wp-config.php (PHP uses the first definition and ignores later ones), or a plugin calls ini_set('display_errors', '1'), which overrides the constant.
Fix: Check wp-config.php for a second WP_DEBUG_DISPLAY definition and remove it. If none exists, check active plugins for code that sets display_errors directly.
No. WP Debug Toolkit flags debug mode (WP_DEBUG) as a critical issue on the Site’s Health page when it stays active in production, and there’s a warning on the Overview page about enabling it for a debugging session and disabling it when you’re done. Ideally, you should turn on WP_DEBUG and WP_DEBUG_LOG while actively investigating an issue, then disable them once you have what you need. For ongoing alerts when fatal errors occur, set up Email Notifications.
SAVEQUERIES stores every database query for a page load in memory so you can inspect them. It is useful for a targeted debugging session but not recommended permanently on production, since it adds memory overhead to every request. WPDT’s file-based query logging gives you ongoing query visibility with far lower overhead. See Always-On Logging Mode for the lower-overhead alternative.
By default, WordPress writes to wp-content/debug.log once WP_DEBUG_LOG is enabled. Some hosts use a different path. WPDT automatically detects the active path and displays it under WP Debug Toolkit › Settings › Viewer Settings, in the File Paths Configuration section’s Debug Log card, marked as Auto-detected. You can override it manually if your host uses a non-standard location.
Navigate to WP Debug Toolkit › Overview › Error Logging and click the WP_DEBUG row in the Debug Constants list to disable it. WPDT writes the change to wp-config.php using the same atomic process it uses when enabling constants: the change goes to a temp file, is syntax-checked, then is swapped in. If anything fails, your existing wp-config.php is left untouched.
How to Automatically Enable WordPress Debug Mode – Walk through the toggle interface step by step, with screenshots showing exactly where to click.
How to Safely Modify wp-config.php – See how WPDT protects wp-config.php with atomic writes, automatic backups, and rollback every time a constant changes.
How to Filter and Search WordPress Error Logs – Cut through a growing debug.log and zero in on the errors that actually need your attention.
