
Navigate to WP Debug Toolkit › Overview › Database Queries and click Record, set a duration, and click Start Recording. Reproduce the slow page load once while the recording is active. Afterward, open the Viewer App and go to Database Queries to read the results. Slow queries carry a red SLOW badge, N+1 patterns carry an ⚠ N+1 badge, and each query shows the plugin, theme, or WordPress core component that generated it. Hover over any flagged query and click View file to open the responsible code in the File Viewer. Query logs are written to disk as encrypted log files, so recording adds no database overhead to the system being analyzed.
When a page loads slowly and the WordPress error log shows nothing, database queries are the most common culprit. A single poorly-indexed query can add seconds to a page load.
A loop-based query pattern, one where code asks the database for one record per iteration rather than fetching all at once, can multiply database work silently on every request without triggering any visible error.
WPDT’s Database Monitor and File Viewer address this as a paired workflow. The Database Monitor records every SQL query that runs during a page load, annotates each one with execution time and component attribution, and automatically flags slow queries and N+1 patterns.
The File Viewer connects any flagged query directly to the PHP code that generated it. This lets you see which function called it and on which line.
This guide walks you from a slow page load to the exact line of code responsible for it.
| WPDT Tool | Role in This Guide |
|---|---|
| Database Monitor (Query Logger) | Records every SQL query during a request and includes timing, component attribution, and automatic detection of slow queries and N+1 patterns, so you can see exactly what is happening in the database |
| File Viewer | Provides code context for any flagged query, showing the PHP file and the surrounding lines that generated it |
This guide assumes you have the following in place before you start diagnosing:
db.php drop-in as part of that process, without any manual step.Note: If a non-WPDT db.php file already exists in wp-content/, WPDT will not overwrite it. Component attribution and stack traces will not appear until the conflicting file is removed.
A recording session captures all database queries during a specific time window. Start it immediately before you reproduce the slow behavior.
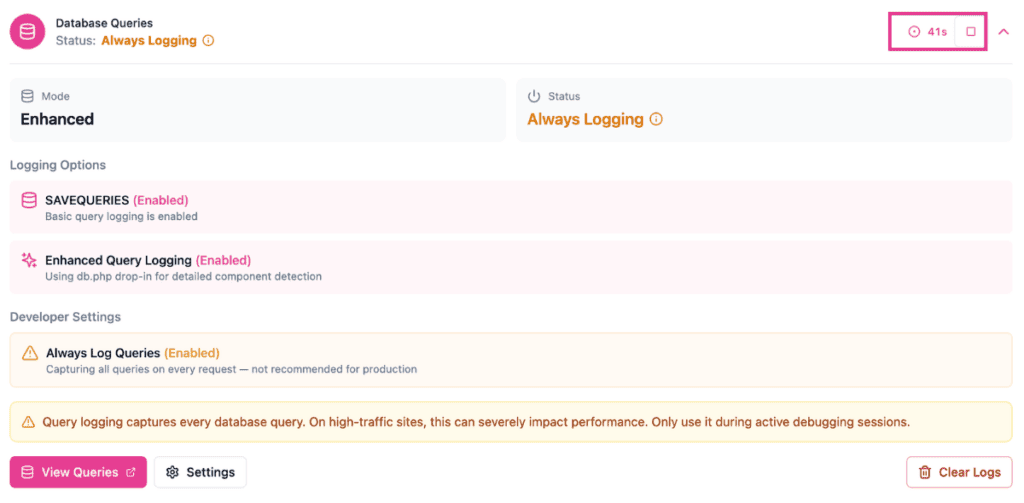
Navigate to WP Debug Toolkit in the WordPress admin sidebar. The Overview tab opens by default. The Database Queries section is visible on that page without expanding anything. When no recording is active, the Record button sits on the right side of the Database Queries section header. Click it to open the Record Queries dialog.
In the dialog, set a Recording duration between 1 and 3,600 seconds. 60 seconds is sufficient for diagnosing a specific page load. You can also add an optional Recording tag to label the session, for example, checkout-slow, which makes it easier to filter results afterward. Click Start Recording (the button shows the formatted duration, for example Start Recording (1m)).
When the recording starts, WPDT automatically enables SAVEQUERIES and Enhanced Query Logging. The db.php drop-in is installed at this point, which intercepts queries at the WordPress database layer and captures a full stack trace for each one.
✅ What You Should See: The Record button is replaced by a countdown timer showing the remaining recording time alongside a small stop icon in the Database Queries section header, confirming the recording is active.
Load the slow page, trigger the slow admin action, or perform the operation that produces the slow behavior. Reproduce it exactly once during the recording window. A second reproduction in the same window mixes its queries into the log alongside the first. This makes it harder to isolate the source of the slowness.
Once you have triggered the slow behavior, either wait for the recording timer to expire or click the stop icon in the Database Queries section header to end the session immediately.
✅ What You Should See: The countdown timer disappears and the Record button returns to the Database Queries section header, confirming the recording has ended and the query log has been written to disk.
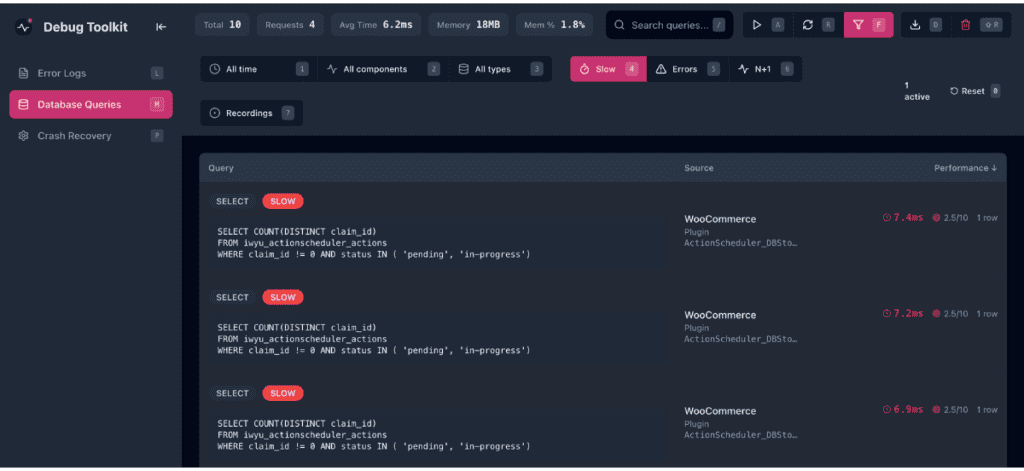
Open the Viewer App and navigate to Database Queries in the sidebar (keyboard shortcut: M). The view displays every query captured during the recording window, each showing its execution time, SQL type, component, and any problem flags. Slow query rows have a red background tint to draw immediate attention.
Click Filters (shortcut: F) to open the filter panel, then use the toggles to narrow the view:
If you used a Recording tag, click the Recording filter (shortcut: 7) to isolate queries from your specific session.
🔀 Decision Point
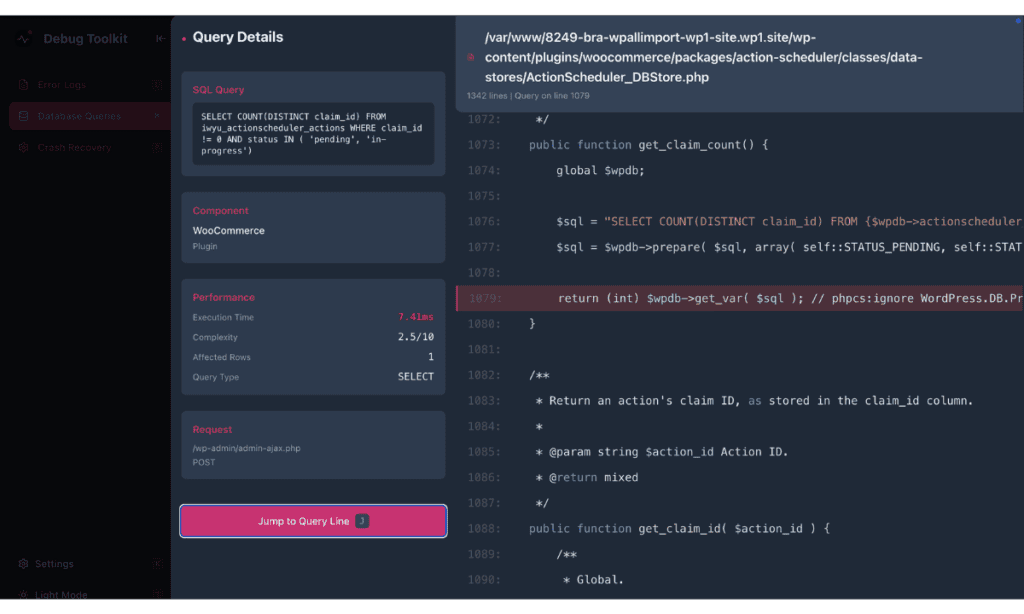
After identifying which category your problem falls into, hover over the flagged query row. A View file button appears alongside a Copy SQL button. Click View file (or press Q) to open that query’s origin in the File Viewer.
✅ What You Should See: The File Viewer displays the PHP file responsible for the query, with the specific line highlighted and surrounding code visible in context. The Component label in the detail panel confirms the plugin, theme, or core file that owns the code.
Recording writes query data to disk as encrypted log files rather than storing anything in the database, so the act of logging adds no database overhead to the system being analyzed. There is a separate consideration, though: once the db.php drop-in is installed, it instruments every query on every page load, not only during an active recording, so there is some CPU overhead while the drop-in is in place. That overhead is gone entirely once you turn off query logging and remove the drop-in. For most sites this is negligible, but on very high-traffic pages, keep recordings short and avoid leaving Always Log Queries on indefinitely.
The component shown on each query row identifies the originating plugin, theme, or WordPress core component directly from the backtrace. If the component shows a plugin name, that plugin’s code generated the query. Hover over the row and click View file to open the specific file and line in the File Viewer.
Slow Query, N+1, and Duplicate Detection – Explains exactly how WPDT identifies each query problem type, including how the slow-query threshold is calculated, what triggers an N+1 flag, and how duplicates are fingerprinted.
Recording WordPress Database Queries – Takes you through the full recording workflow: starting a session, stopping it early, using the countdown timer, and reading the results.
How to Debug WordPress – Start here if slow database queries turn out not to be the cause. This guide routes you to the right diagnostic tool for whatever you are seeing.
